U.S. futures are firmer as chip and AI stocks rebound, oil eases on reduced Middle East tension, and higher yields keep volatility elevated.
Fundamentals: Equity index futures are higher as chipmakers and AI-linked stocks recover, while easing Middle East tensions reduce the latest oil risk premium. The move comes alongside higher bond yields, a firmer inflation and Fed-policy backdrop, and continued option-driven volatility. Gold and silver remain soft, and sector rotation toward defensives has persisted.
Technicals: The pre-market session shows a mixed but broadly constructive backdrop across U.S. futures and major global indices. ETF movers were led by IBIT, TSLA, and NVDA on the upside, while AAPL, META, and GOOG were weaker. Higher timeframes remain largely bullish in ES, NQ, YM, RTY, and FDAX, even as several daily charts reflect near-term pullbacks, resistance tests, or rotation after recent rallies.
Pre-Market Trading 360° view Market Radar of: holidays, earnings, eco-news, market-news summary, news sentiment, prior session major ETFs, MAG7, Higher Time Frame Analysis Indices Futures Summary, and E-mini S&P500, Nasdaq 100, NYMEX Crude, Gold Futures Daily Chart analysis.
As of: June 9, 2026 07:16 CT
Earnings Radar
Monitoring for earnings releases by the Magnificent 7, AI-tech-related firms, and major financial institutions.
- ADBE Release: 2026-06-11 T:AMC
- ORCL Release: 2026-06-10 T:AMC
Conclusion: ORCL reports on 2026-06-10 after the close, followed by ADBE on 2026-06-11 after the close, keeping near-term focus on large-cap software and broad tech sentiment. Market momentum and volume can slow ahead of major earnings releases, especially in major tech names.
For full details visit: Yahoo Earnings Calendar
EcoNews Radar U.S. Events
| Day | Time | Impact | Event |
|---|---|---|---|
| Wed | 08:30 | High | Core CPI m/m |
| Wed | 08:30 | High | Core CPI y/y |
| Wed | 08:30 | High | CPI m/m |
| Wed | 08:30 | High | CPI y/y |
| Wed | 10:30 | Low | Crude Oil Inventories |
| Thu | 08:30 | High | Core PPI m/m |
| Thu | 08:30 | High | PPI m/m |
| Thu | 08:30 | Medium | Unemployment Claims |
| Fri | 10:00 | Medium | Prelim UoM Consumer Sentiment |
| Fri | 10:00 | Medium | Prelim UoM Inflation Expectations |
EcoNews Summary
Wednesday carries the highest market focus with multiple high-impact inflation releases, centered on Core CPI and CPI at 08:30. These measures track consumer price changes and underlying inflation pressure, and index futures traders monitor them for their direct influence on rate expectations, Treasury yields, and broad risk sentiment. Wednesday also includes Crude Oil Inventories at 10:30, a petroleum supply report that tracks stockpile changes and feeds into energy-price and inflation sensitivity.
Event Notes:
- Wednesday 08:30 Core CPI m/m: Measures month-over-month change in consumer prices excluding food and energy; a key read on underlying inflation and policy pressure.
- Wednesday 08:30 Core CPI y/y: Measures year-over-year change in consumer prices excluding food and energy; watched for the broader inflation trend.
- Wednesday 08:30 CPI m/m: Measures month-over-month change in consumer prices across the full basket; a major inflation release with broad market impact.
- Wednesday 08:30 CPI y/y: Measures year-over-year change in consumer prices across the full basket; a primary gauge of inflation momentum.
- Wednesday 10:30 Crude Oil Inventories: Measures weekly changes in U.S. crude stockpiles; important for oil, energy prices, and inflation-linked market moves.
- Thursday 08:30 Core PPI m/m: Measures month-over-month change in producer prices excluding food and energy; a pipeline inflation indicator watched for cost pressure at the producer level.
- Thursday 08:30 PPI m/m: Measures month-over-month change in producer prices; used to assess inflation at the wholesale stage.
- Thursday 08:30 Unemployment Claims: Measures new filings for jobless benefits; a labor-market indicator that informs growth and policy sensitivity.
- Friday 10:00 Prelim UoM Consumer Sentiment: Measures preliminary consumer confidence; monitored for household demand and growth tone.
- Friday 10:00 Prelim UoM Inflation Expectations: Measures consumer inflation expectations; closely followed for inflation persistence signals.
Conclusion:
Wednesday is the most important day of the week, with the 08:30 Core CPI and CPI releases as the central market-moving events. Market momentum and volume often slow ahead of major inflation data, then shift sharply at the release time. The 10:30 Crude Oil Inventories report adds an energy-price catalyst later that morning, with direct relevance to crude supply and inflation sensitivity.
For full details visit: Forex Factory EcoNews
Market News Summary:
Equity futures are firming as chip and AI names rebound, while Middle East tension eases and oil softens; higher yields and a weaker gold backdrop keep volatility elevated.
Primary Drivers & Risks:
- Primary Driver: Tech rebound and easing tensions
- Primary Risk: Higher yields and volatility
Tone:
Risk appetite is improving, but cross-asset volatility remains elevated.
Stock Market / ETFs / Indices:
U.S. stock-index futures rose as chipmakers and AI-linked stocks recovered, with Nasdaq and S&P futures gaining. Recent weakness was concentrated in growth and technology, while defensive sectors provided offset; investors also noted elevated option activity and higher implied volatility.
Geopolitical:
Middle East tensions eased after Iran and Israel pulled back from the latest escalation and signaled a halt to direct hostilities. News flow still highlighted residual uncertainty around renewed conflict and the Strait of Hormuz.
Oil / Energy:
Crude prices moved lower after the ceasefire and pullback in direct attacks reduced the immediate risk premium. Earlier headlines cited overnight crude spikes, but later coverage pointed to pressure on WTI and Brent near key support levels.
Gold / Metals:
Gold fell as inflation concerns and restrictive policy expectations weighed on the metal. Later updates described further weakness below key levels, with silver also under pressure.
Fed / Financials:
Higher bond yields and a forthcoming Fed meeting added pressure to stocks. Headlines also noted rising Fed hike odds and commentary around inflation concerns and policy direction.
Macro / Other:
Asian tech stocks rebounded alongside Wall Street chip names, and AI-related fundraising remained a market theme. Separate headlines referenced Indonesia’s rate hike to support the rupiah and a strong month for Asian equity revenues.
Conclusion:
Primary drivers are the rebound in technology shares and the easing of Middle East stress, which support index futures and reduce the crude oil risk premium. That positive backdrop is tempered by higher bond yields, Fed policy sensitivity, and ongoing volatility across stocks, metals, and energy.
Secondary drivers include continued AI and IPO-related equity flows, plus signs of sector rotation toward defensives during recent weakness. Cross-currents remain from geopolitics, inflation concerns, and technical pressure in oil and gold.
Market News Sentiment
Market News Articles: 39
- Positive: 48.72%
- Neutral: 25.64%
- Negative: 25.64%
Sentiment Summary: News flow is slightly positive overall, with 49% positive articles and 26% each neutral and negative across 39 articles.
Conclusion: The news mix shows a modest positive bias with balanced neutral and negative coverage.
GLD,Gold Articles: 9
- Negative: 44.44%
- Positive: 33.33%
- Neutral: 22.22%
Sentiment Summary: GLD and gold news sentiment is mixed, with 44% negative, 33% positive, and 22% neutral coverage across 9 articles.
Conclusion: The article set shows a slight negative bias in gold-related sentiment, with no clear directional dominance.
USO,Oil Articles: 15
- Negative: 53.33%
- Positive: 26.67%
- Neutral: 20.00%
Sentiment Summary: USO/oil coverage is skewed negative, with 53% negative, 27% positive, and 20% neutral across 15 articles.
Conclusion: The news flow on oil is primarily negative, indicating a bearish tone in the USO/oil sentiment snapshot.
Market Data Snapshot
ETF Snapshot of major stock market ETFs, Mag7, and others as of: June 9, 2026 07:16
Top Movers & Losers
- IBIT 35.89 Bullish 5.13% ▲
- TSLA 408.95 Bullish 4.59% ▲
- NVDA 208.64 Bullish 1.73% ▲
- GOOG 361.17 Bearish -1.25% ▼
- META 585.39 Bearish -1.28% ▼
- AAPL 301.54 Bearish -1.89% ▼
Major Index ETFs: SPY, QQQ, DIA, IWM, IJH
- QQQ 716.07 Bullish 1.56% ▲
- IWM 284.11 Bullish 0.87% ▲
- SPY 739.22 Bullish 0.23% ▲
- IJH 74.11 Bullish 0.22% ▲
- DIA 508.91 Bearish -0.15% ▼
Mixed tone across the index ETF complex, led by QQQ at +1.56% as the most bullish mover, with IWM also firm at +0.87%; SPY +0.23% and IJH +0.22% were near-flat positive, while DIA was the most bearish mover at -0.15%.
Mag 7 Stocks: AAPL, MSFT, GOOG, AMZN, META, NVDA, TSLA
- TSLA 408.95 Bullish 4.59% ▲
- NVDA 208.64 Bullish 1.73% ▲
- AMZN 245.22 Bearish -0.33% ▼
- MSFT 411.74 Bearish -1.18% ▼
- GOOG 361.17 Bearish -1.25% ▼
- META 585.39 Bearish -1.28% ▼
- AAPL 301.54 Bearish -1.89% ▼
Mag7 action is Mixed, led by TSLA at +4.59% as the most bullish mover and NVDA at +1.73% also positive, while AAPL at -1.89% is the most bearish mover; META at -1.28%, GOOG at -1.25%, MSFT at -1.18%, and AMZN at -0.33% are all lower.
Cross-Market ETFs: TLT, GLD, USO, IBIT
- IBIT 35.89 Bullish 5.13% ▲
- USO 135.15 Bullish 1.60% ▲
- GLD 397.27 Bullish 0.26% ▲
- TLT 84.62 Bearish -0.52% ▼
Mixed tone across the group: IBIT was the most bullish mover at +5.13%, followed by USO at +1.60% and GLD near flat at +0.26%, while TLT was the most bearish mover at -0.52%.
ETF, Mag7, and Cross-Market ETF Insights
Overall Tone
Mixed-to-Bullish, with risk-on conditions supported by strength in +5.13% IBIT, +4.59% TSLA, and +1.56% QQQ, while several large-cap names remain under pressure.
Equity ETFs and Mag7:
Major index ETFs are broadly aligned but not uniform: QQQ led the index complex at +1.56%, while SPY +0.23%, IWM +0.87%, and IJH +0.22% were only modestly positive, and DIA was nearly flat at -0.15%. Mag7 leadership is selective, with TSLA the most bullish mover at +4.59% and NVDA also positive at +1.73%, while AAPL was the most bearish mover at -1.89% and META, GOOG, MSFT, and AMZN were also lower.
Cross-Market ETFs:
Cross-market signals are mixed: IBIT was the most bullish mover overall at +5.13%, USO also firmed at +1.60%, and GLD was near-flat at +0.26%, while TLT was the most bearish mover in this group at -0.52%. Relative to equities, the mix points to stronger participation in crypto and energy, mild support in gold, and softer Treasuries alongside the equity advance.
Futures Indices – Higher Time Frame Analysis
Summary of the current state of US Indices Futures based on higher time-frame (HTF) technical analysis as of: 2026-06-09: 07:16 CT.
US Indices Futures
- ES YSFG/WSFG above F0% with MSFG below; benchmarks stacked higher; pivots UTrend; resistance 7632.25, support 7355 and 7200 area.
- NQ YSFG/WSFG above F0%, MSFG below; benchmarks upward; pivots UTrend on higher frames, daily pullback; resistance 30807.75, support 28744.50 then 28213.25.
- YM YSFG/WSFG above F0%, MSFG below; benchmarks stacked higher; pivots UTrend; resistance 51849, supports 50624, 48808, 45052, 39331.
- EMD YSFG/WSFG above F0%, MSFG below; benchmarks rising; pivots UTrend; resistance near 3782, support layered below recent swing highs.
- RTY YSFG/WSFG above F0%, MSFG below; benchmarks mostly higher; pivots UTrend on weekly, daily pullback; resistance 2952.0, support 2807.7 then 2682.2.
- FDAX YSFG/WSFG above F0%, MSFG below; benchmarks upward on weekly, clustered on daily; pivots mixed to down daily; resistance 25494, 25656, 25854, support 24356.
Overall State
- Short-Term: Neutral
- Intermediate-Term: Neutral
- Long-Term: Bullish
Conclusion
YSFG and WSFG remain above F0% on ES, NQ, YM, EMD, RTY, and FDAX, while MSFG is still below midpoint across most contracts. Weekly structure is aligned upward with benchmark stacks broadly constructive, while daily structure shows rotation and pullbacks near recent swing highs. Pivot trends remain UTrend on the higher frames for the US indices, with nearby resistance defined by prior highs and support layered at recent swing pivots and benchmark clusters. The higher-timeframe backdrop remains trend-aligned upward, with intermediate monthly grids still lagging the weekly and yearly structures.
Note: Intra-day counter-trend pullbacks or retracements may occur, HTF is context for informational usage and market structure. Glossary: Session Fib Grids periods of YSFG:’Yearly’, MSFG:’Monthly’, WSFG:’Weekly’
For full details visit: AlphaWebTrader Technicals
ES Daily View
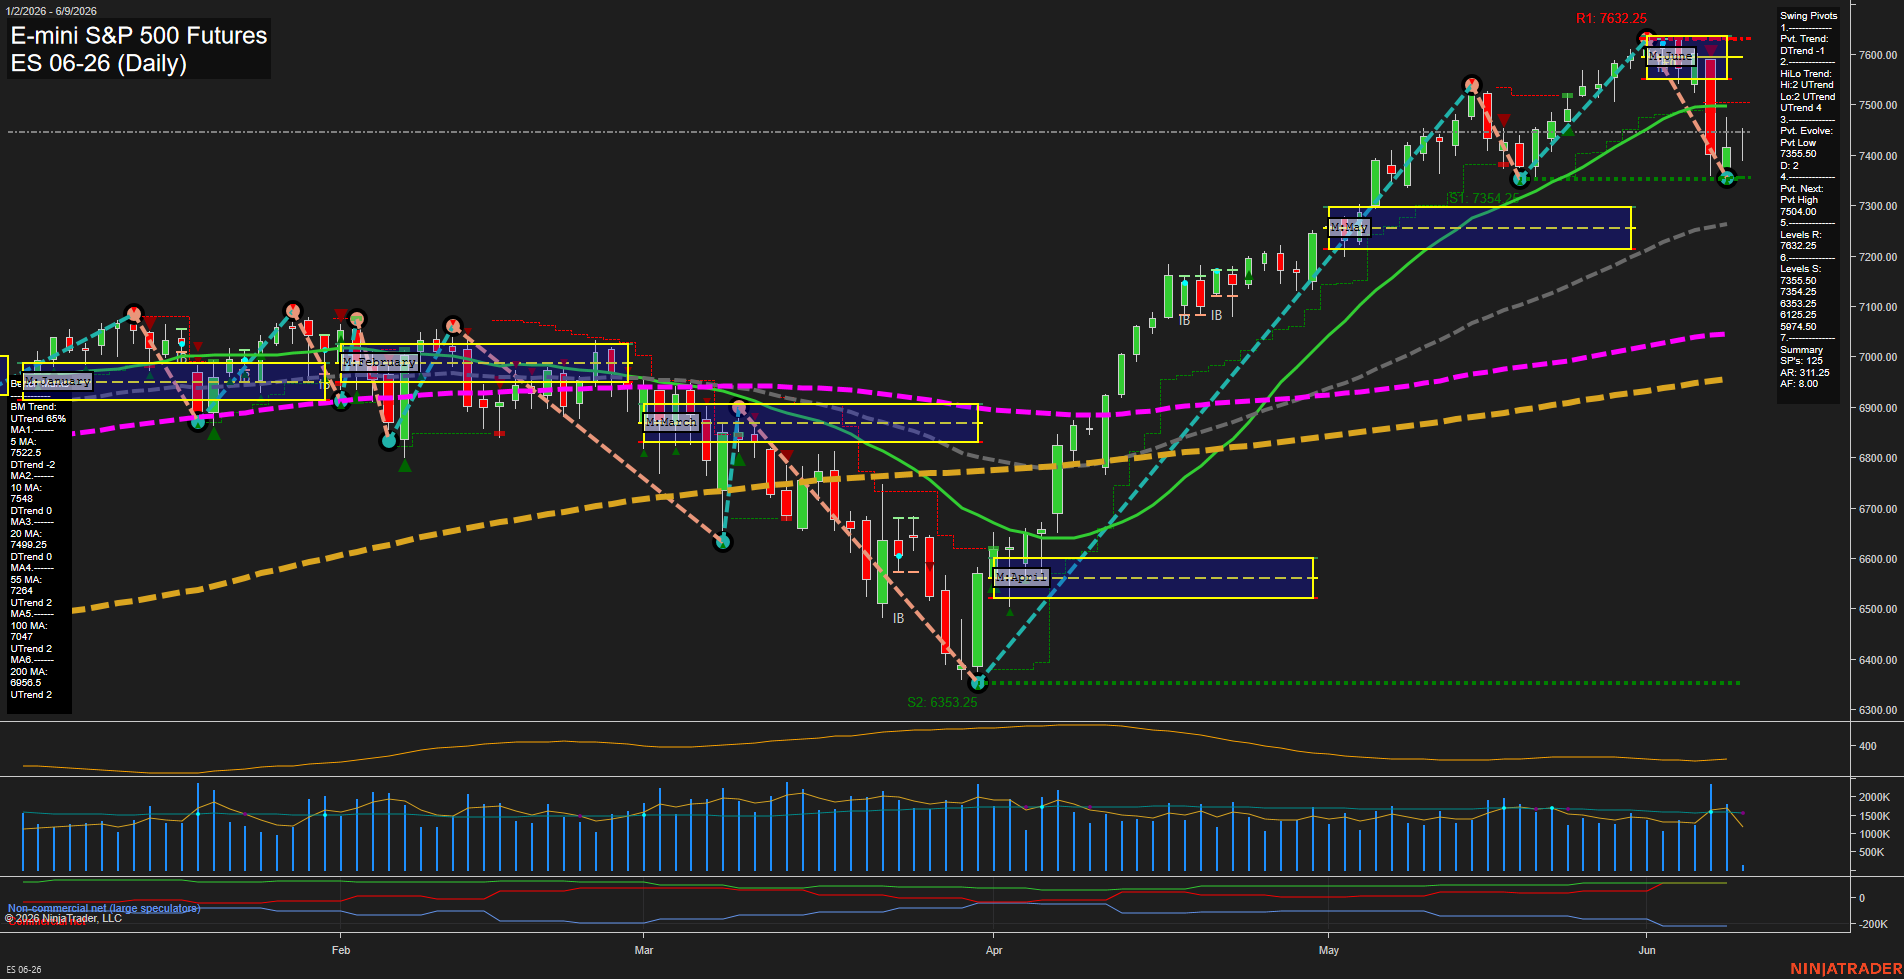
Overall Rating
- Short-Term: Bullish
- Intermediate-Term: Bullish
- Long-Term: Bullish.
Key Insights Summary
ES has recovered sharply from the April low and is still holding a constructive higher-low structure into early June, with price pressing near the upper June session fib area after a strong run to the 7632.25 resistance. The pivot structure remains in UTrend on both the short-term and the hi/lo intermediate view, while the trade map shows the market has recently rotated off the highs and back toward the 7355 area. Benchmark alignment is broadly supportive above the 20, 55, 100, and 200-day averages, even though the 5 and 10-day lines have turned down with the latest pullback. The monthly session fib grid remains below F0%, keeping the June monthly context down, while the weekly and yearly session grids remain above F0% and aligned to the upside. The overall profile is a mixed-to-bullish swing backdrop: a strong multi-month rally, a nearby resistance test, and a short-term retracement inside a larger uptrend.
View charts on: AlphaWebTrader HTF Charts
NQ Daily View
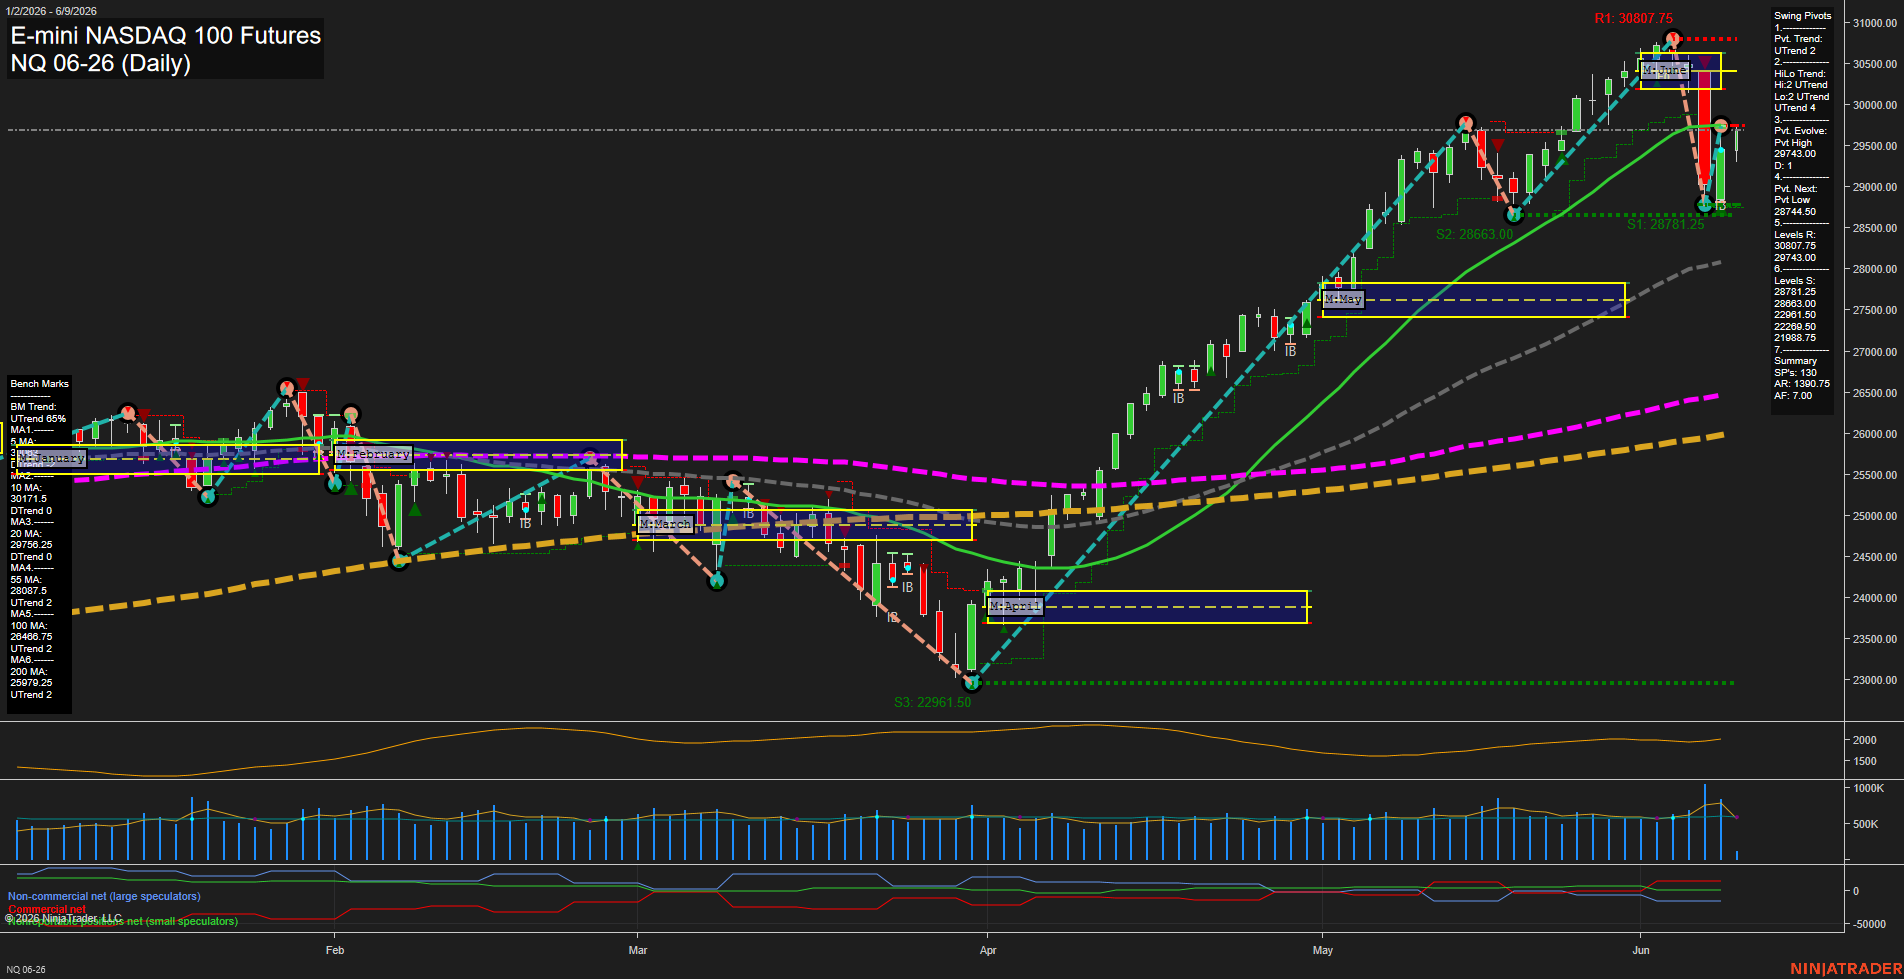
Overall Rating
- Short-Term: Neutral
- Intermediate-Term: Bearish
- Long-Term: Bullish.
Key Insights Summary
Daily price is tracking a strong swing structure with a sharp late-session reversal from the upper band back toward the 29.7k area. The weekly grid remains constructive above F0%, but the monthly grid is still negative and keeps the intermediate tone pressured. Swing pivots show the market has just printed a pivot high at 29743.00, with the next opposite pivot level lower at 28744.50, while the higher resistance at 30807.75 defines the upper swing ceiling. Benchmark alignment is mixed: the shorter averages are soft and the broader averages remain rising, which fits a market that is still in a larger uptrend but has entered a volatile pullback/consolidation phase after a strong rally and recent rejection near the highs.
View charts on: AlphaWebTrader HTF Charts
CL Daily View
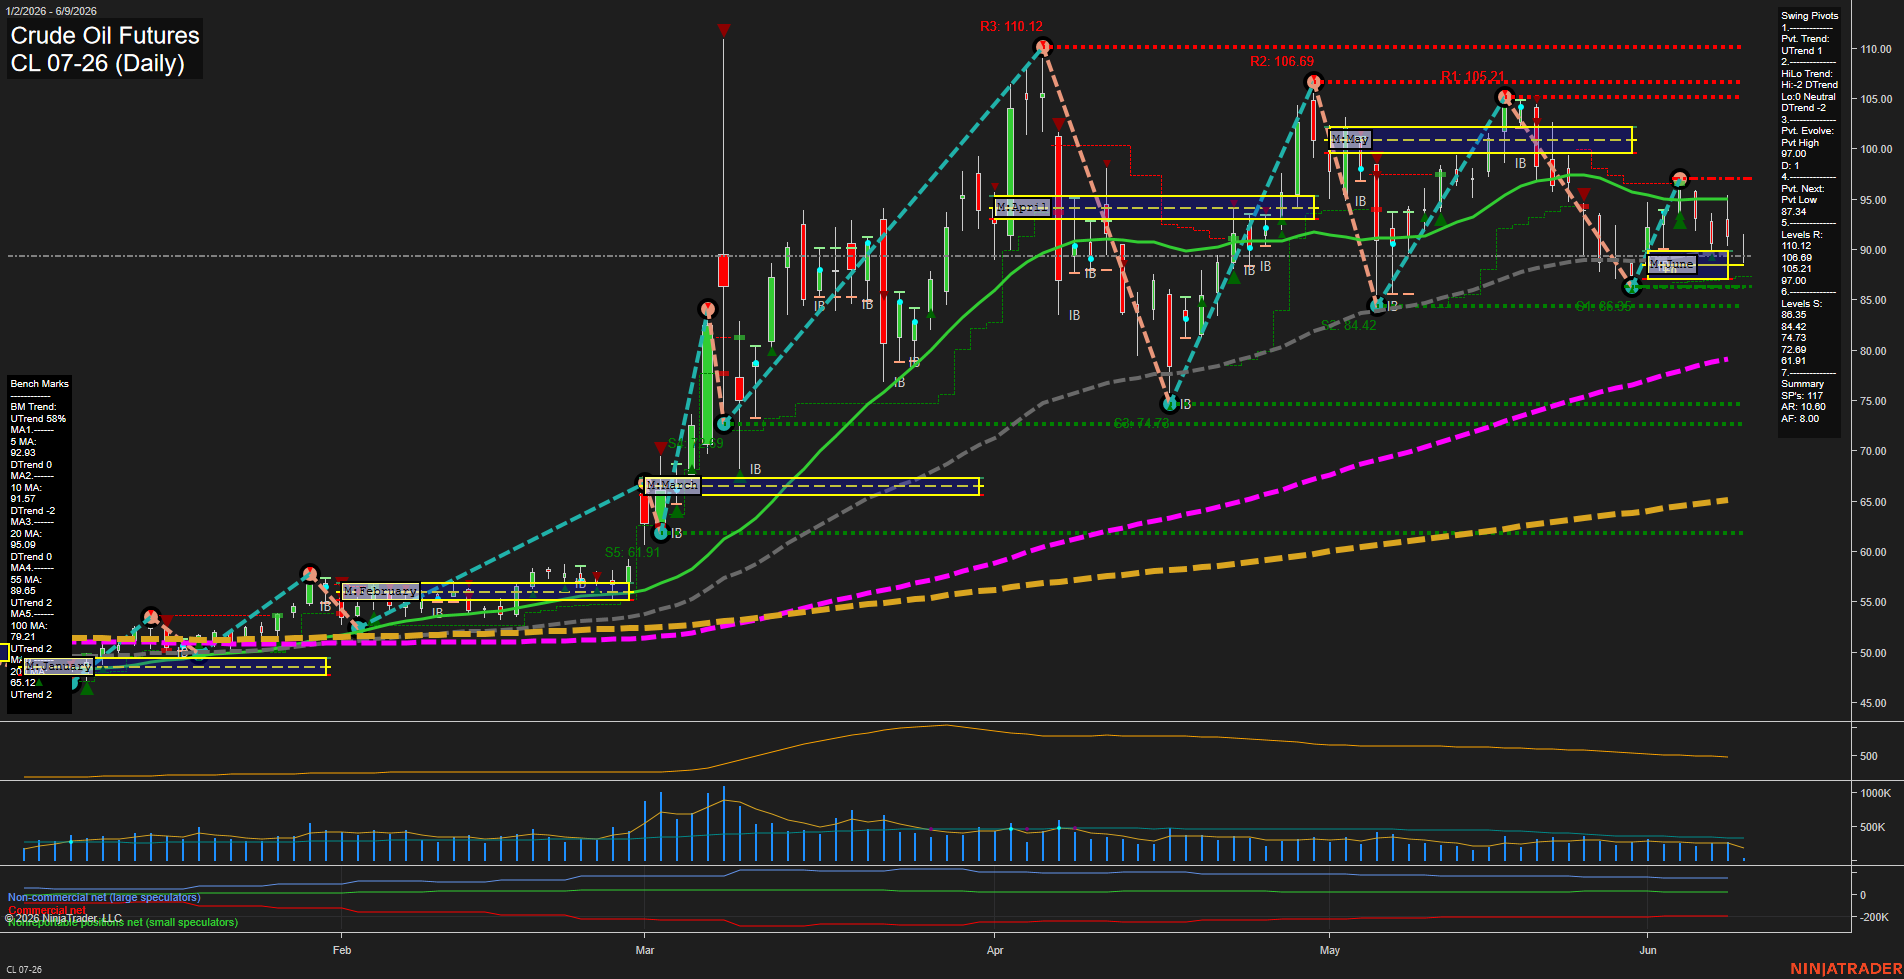
Overall Rating
- Short-Term: Bearish
- Intermediate-Term: Bearish
- Long-Term: Bullish.
Key Insights Summary
Crude oil is in a sharp daily pullback after a strong spring advance and recent failed tests near the 105 to 110 zone. Short-term structure has rolled over with price trading below the weekly fib grid midpoint and below the near-term moving average stack, while the pivot sequence has shifted to a lower-high / lower-low correction pattern. Intermediate-term momentum remains pressured as June sits below its monthly fib balance zone and the 20-day benchmark, keeping the monthly trend tilted down. At the same time, the broader year-long structure still points higher, supported by the rising 55, 100, and 200 day benchmarks and the positive yearly fib position, so the chart remains a larger uptrend inside a corrective selloff. The recent bar action shows an expanded range move with volatility elevated and a failed recovery back toward the mid-90s, leaving the market in a choppy transition phase between long-term uptrend support and short-term trend weakness.
View charts on: AlphaWebTrader HTF Charts
GC Daily View
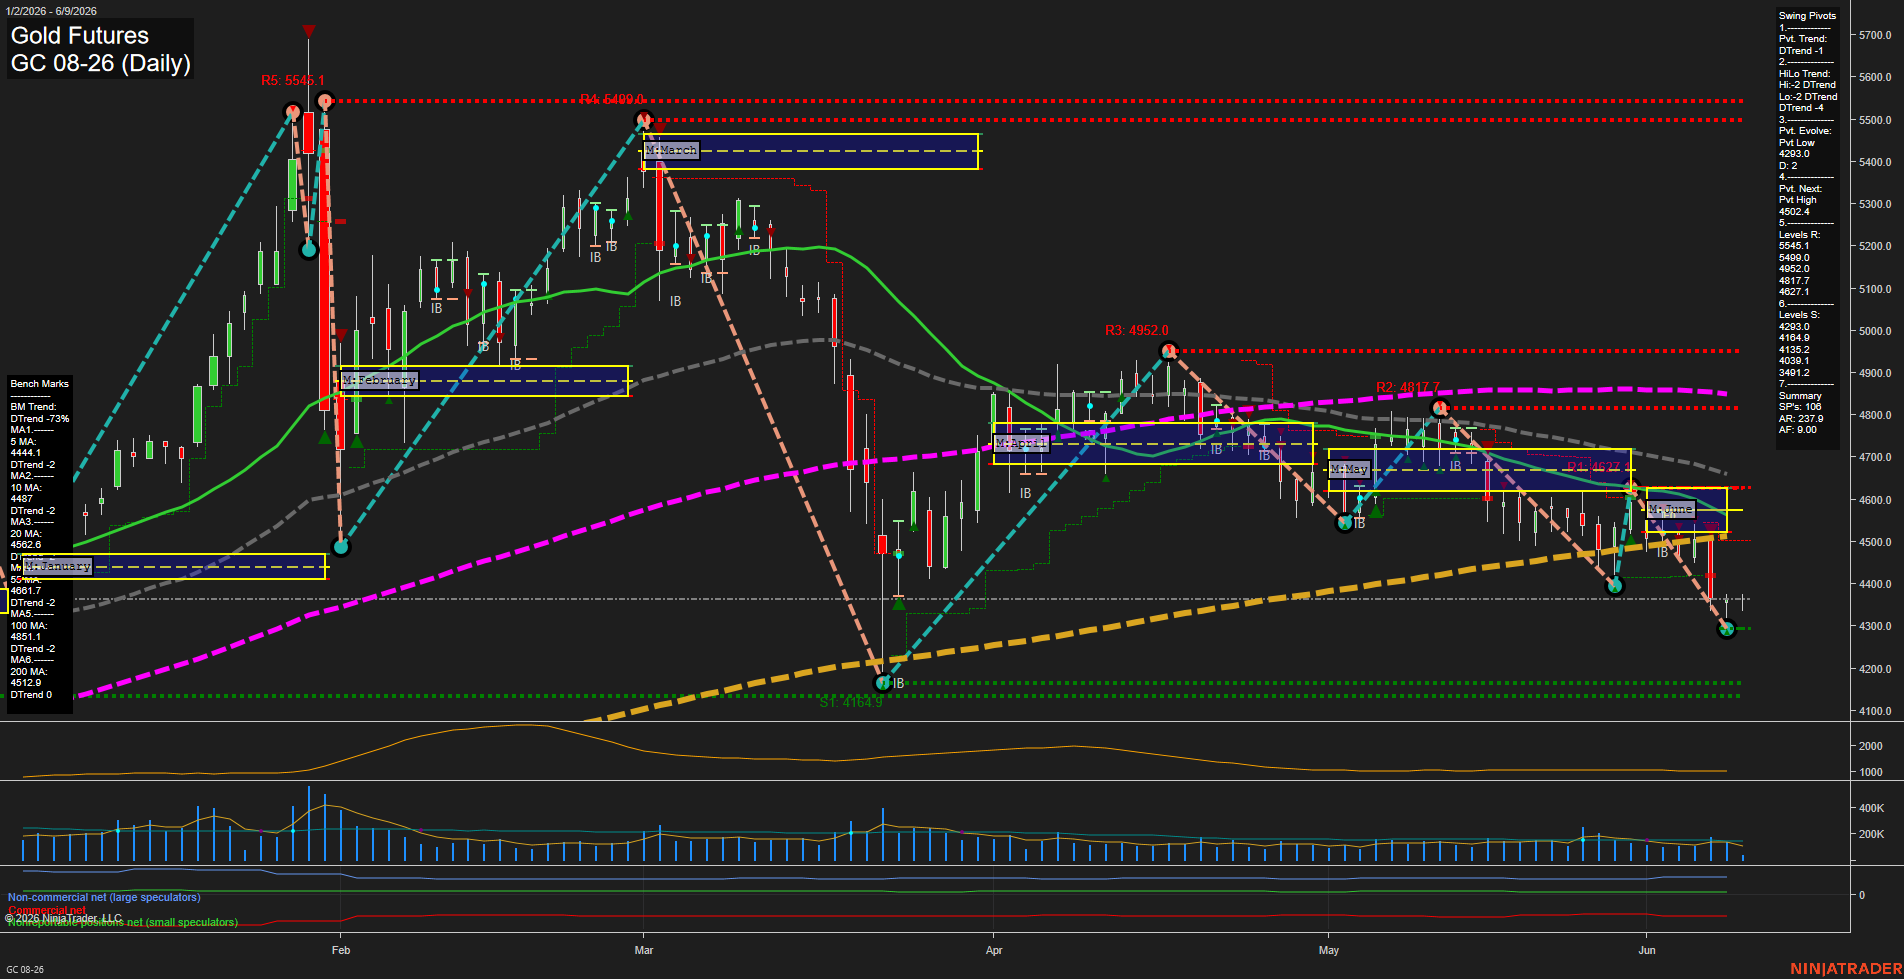
Overall Rating
- Short-Term: Bearish
- Intermediate-Term: Bearish
- Long-Term: Bearish.
Key Insights Summary
Gold futures are pressing into a lower pivot zone after a steep downside swing, with the current pivot structure still aligned bearish across both the short and intermediate horizons. Price is trading below the 5, 10, 20, 55, and 100 day benchmarks, reinforcing a broad corrective-to-downtrend profile, while the 200 day remains above price and no longer provides immediate trend support. The weekly fib grid remains positive, but the monthly and yearly session grids are both negative, showing the larger frame is still dominated by rejection from higher levels and continuation lower from the March and May distribution zones. Recent signals confirm sustained downside momentum, and the chart is working through prior support layers near 4293, 4164.9, and 4135.2 after losing the 4500 to 4600 area. The broader pattern remains one of lower highs and lower lows with repeated failed recoveries beneath the benchmark averages.
View charts on: AlphaWebTrader HTF Charts