NYSE pre-market radar tracks ETF movers and futures technicals as U.S. equity futures rise, while Fed, earnings, tariffs and oil risks remain in focus.
Fundamentals: U.S. index futures advanced as reports of a pause in U.S.-Iran fighting eased concerns about energy supply disruptions and pushed crude prices lower. Markets remain focused on the Federal Reserve decision and major technology earnings, while conflict developments, new tariffs, elevated yields and AI-investment concerns continue to shape risk sentiment.
Technicals: Pre-market technical readings show a mixed backdrop: ES holds a bullish short-term rebound within a softer intermediate structure, while NQ remains corrective. YM, EMD and FDAX retain broadly constructive longer-term trends, while RTY is consolidating. Prior-session movers included gains in AAPL and DIA and declines in META, USO and TSLA.
Pre-Market Trading 360° view Market Radar of: holidays, earnings, eco-news, market-news summary, news sentiment, prior session major ETFs, MAG7, Higher Time Frame Analysis Indices Futures Summary, and E-mini S&P500, Nasdaq 100, NYMEX Crude, Gold Futures Daily Chart analysis.
As of: July 27, 2026 07:16 CT
Earnings Radar
Monitoring for earnings releases by the Magnificent 7, AI-tech-related firms, and major financial institutions.
- AAPL Release: 2026-07-30 T:AMC
- AMZN Release: 2026-07-30 T:AMC
- META Release: 2026-07-29 T:AMC
- MSFT Release: 2026-07-29 T:AMC
Conclusion: S&P 500 and Nasdaq futures face concentrated mega-cap earnings catalysts: MSFT and META report after the close July 29, followed by AAPL and AMZN after the close July 30. Market momentum and volume can slow ahead of these major tech releases, while index sensitivity rises around the post-close results and subsequent cash-session repricing.
For full details visit: Yahoo Earnings Calendar
EcoNews Radar U.S. Events
| Day | Time | Impact | Event |
|---|---|---|---|
| Tue | 10:00 | Medium | CB Consumer Confidence |
| Wed | 10:30 | Low | Crude Oil Inventories |
| Wed | 14:00 | High | Federal Funds Rate |
| Wed | 14:00 | High | FOMC Statement |
| Wed | 14:30 | High | FOMC Press Conference |
| Thu | 08:30 | High | Advance GDP q/q |
| Thu | 08:30 | High | Core PCE Price Index m/m |
| Thu | 08:30 | Medium | Advance GDP Price Index q/q |
| Thu | 08:30 | Medium | Unemployment Claims |
| Fri | 08:30 | Medium | Employment Cost Index q/q |
| Fri | 10:00 | Medium | Revised UoM Consumer Sentiment |
| Fri | 10:00 | Medium | Revised UoM Inflation Expectations |
EcoNews Summary
The week’s qualifying releases center on the Federal Reserve’s policy decision and Thursday’s growth and inflation data. Wednesday’s FOMC communications concentrate interest-rate, policy-path, and financial-conditions information. Thursday’s Advance GDP and Core PCE Price Index provide a combined view of economic activity and underlying inflation.
Event Notes:
- Wednesday 14:00 Federal Funds Rate: The Federal Reserve’s target interest-rate decision. Index futures monitor the rate setting for its influence on borrowing costs, discount rates, financial conditions, and policy expectations.
- Wednesday 14:00 FOMC Statement: The policy statement explains the Federal Reserve’s assessment of economic conditions, inflation, employment, and the policy stance. Traders monitor changes in language regarding rates, inflation, and balance-sheet policy.
- Wednesday 14:30 FOMC Press Conference: The Federal Reserve Chair provides further policy context and answers questions following the decision. Remarks often clarify the statement’s policy message and affect rate-sensitive markets.
- Thursday 08:30 Advance GDP q/q: The first estimate of quarterly U.S. economic growth. It measures changes in inflation-adjusted output and informs market views on growth momentum and broader economic conditions.
- Thursday 08:30 Core PCE Price Index m/m: A measure of monthly underlying personal-consumption inflation excluding food and energy. It is monitored for inflation trends relevant to Federal Reserve policy assessments.
Conclusion:
Wednesday is the week’s most important day, led by the 14:00 FOMC Statement, alongside the Federal Funds Rate decision and 14:30 press conference. Market momentum and volume often slow ahead of major FOMC, PCE, and GDP releases, with increased volatility at release time. Thursday’s simultaneous GDP and Core PCE releases add a major growth-and-inflation information point.
For full details visit: Forex Factory EcoNews
Market News Summary:
Index futures rose as a reported U.S.-Iran pause eased immediate energy-supply concerns ahead of the Federal Reserve decision and major technology earnings.
Primary Drivers & Risks:
- Primary Driver: U.S.-Iran fighting pause lowers oil
- Primary Risk: Fed, earnings, tariffs, conflict reversal
Tone:
Near-term risk appetite improved, while event risk remains elevated.
Stock Market / ETFs / Indices:
U.S. stock-index futures advanced alongside the drop in crude prices. The S&P 500 and Nasdaq 100 face a busy week of major corporate results and the Fed decision; AI-linked shares remain volatile amid concerns about heavy infrastructure spending and valuation pressure.
Geopolitical:
Reports said Iran would suspend attacks while a U.S. pause in strikes held, raising prospects for de-escalation and resumed shipping through the Strait of Hormuz. The conflict remains a central cross-market catalyst after two weeks of attacks.
Oil / Energy:
WTI and Brent fell sharply, with reports citing declines of more than 5% to 6% as supply-disruption fears eased. Brent moved back below $90 a barrel, though separate commentary highlighted renewed escalation and inflation risks if energy prices rise again.
Gold / Metals:
Gold gained as oil retreated, Treasury yields edged lower, and the dollar softened. Precious metals remain focused on the Fed decision, alongside ETF inflows and central-bank demand.
Fed / Financials:
The Federal Reserve meeting is a major market test. Inflation moderated in June largely because of lower energy prices, while the recent oil surge has renewed attention on inflation and rate expectations; Singapore’s central bank also tightened policy in response to oil-related inflation risk.
Macro / Other:
New U.S. tariffs on 60 trading partners revived global trade tensions amid ongoing Middle East disruption and inflation pressure. Asian currencies traded mixed against the dollar, with the conflict pause supporting broader risk appetite.
Conclusion:
The reported pause in U.S.-Iran fighting and the resulting decline in crude prices supported index futures. The Fed decision and major technology earnings are the principal scheduled equity-market drivers.
Conflict developments remain the main risk to oil, inflation, and risk sentiment. Tariffs, elevated yields, and AI-investment concerns add cross-currents for equities.
Market News Sentiment
Market News Articles: 24
- Neutral: 70.83%
- Negative: 20.83%
- Positive: 8.33%
Sentiment Summary: Market news sentiment is predominantly neutral (71%), with negative coverage (21%) exceeding positive coverage (8%).
Conclusion: The news flow presents a neutral tone overall, with a modest negative skew in non-neutral articles.
GLD,Gold Articles: 5
- Positive: 60.00%
- Neutral: 40.00%
Sentiment Summary: Gold-related coverage was 60% positive and 40% neutral across 5 articles.
Conclusion: The gold news tone was moderately positive, with no negative articles reported.
USO,Oil Articles: 8
- Negative: 62.50%
- Neutral: 25.00%
- Positive: 12.50%
Sentiment Summary: USO/Oil coverage is predominantly negative at 63%, with 25% neutral and 13% positive articles.
Conclusion: The oil news tone is negative overall, which is relevant context for indices futures day traders monitoring energy-linked market sentiment.
Market Data Snapshot
ETF Snapshot of major stock market ETFs, Mag7, and others as of: July 27, 2026 07:16
Top Movers & Losers
- AAPL 333.02 Bullish 3.53% ▲
- DIA 518.76 Bullish 0.48% ▲
- IJH 75.77 Bullish 0.42% ▲
- META 595.19 Bearish -1.80% ▼
- USO 136.69 Bearish -2.01% ▼
- TSLA 313.03 Bearish -2.08% ▼
Major Index ETFs: SPY, QQQ, DIA, IWM, IJH
- DIA 518.76 Bullish 0.48% ▲
- IJH 75.77 Bullish 0.42% ▲
- SPY 738.93 Bullish 0.10% ▲
- IWM 291.17 Bearish -0.32% ▼
- QQQ 684.23 Bearish -1.12% ▼
Mixed major index ETF action: DIA is the most bullish mover at +0.48%, followed by IJH at +0.42%. SPY is marginally Bullish at +0.10%, while IWM is Bearish at -0.32%. QQQ is the most bearish mover at -1.12%, highlighting relative downside in growth-heavy exposure.
Mag 7 Stocks: AAPL, MSFT, GOOG, AMZN, META, NVDA, TSLA
- AAPL 333.02 Bullish 3.53% ▲
- GOOG 319.09 Bullish 0.24% ▲
- MSFT 381.70 Bullish 0.03% ▲
- AMZN 232.11 Bearish -0.66% ▼
- NVDA 206.84 Bearish -0.92% ▼
- META 595.19 Bearish -1.80% ▼
- TSLA 313.03 Bearish -2.08% ▼
Mag7 is Mixed: AAPL is the most bullish mover at +3.53%, while TSLA is the most bearish mover at -2.08%. GOOG is modestly Bullish at +0.24% and MSFT is marginally Bullish at +0.03%; AMZN, NVDA, and META are Bearish at -0.66%, -0.92%, and -1.80%, respectively.
Cross-Market ETFs: TLT, GLD, USO, IBIT
- GLD 371.90 Bullish 0.10% ▲
- TLT 83.25 Bullish 0.10% ▲
- IBIT 36.35 Bearish -0.82% ▼
- USO 136.69 Bearish -2.01% ▼
Mixed cross-market conditions: GLD and TLT are marginally Bullish at +0.10% each, tying as the most bullish movers. IBIT is Bearish at -0.82%, while USO is the most bearish mover at -2.01%.
ETF, Mag7, and Cross-Market ETF Insights
Overall Tone
Mixed: large-cap equity and technology weakness contrasts with modestly Bullish SPY, DIA, and IJH, while cross-market action is led lower by USO and IBIT.
Equity ETFs and Mag7:
Major Index ETFs are selective: DIA +0.48%, IJH +0.42%, and SPY +0.10% are Bullish or marginally Bullish, while IWM -0.32% and QQQ -1.12% are Bearish. Mag7 performance is broadly Bearish outside AAPL +3.53%, the most bullish mover, with GOOG +0.24% and MSFT +0.03% modestly Bullish. TSLA -2.08% is the most bearish mover, followed by META -1.80%, QQQ weakness, and NVDA -0.92%, indicating selective rather than broad equity alignment.
Cross-Market ETFs:
TLT +0.10% and GLD +0.10% are marginally Bullish, while IBIT -0.82% and USO -2.01% are Bearish. GLD and TLT share the most bullish move at +0.10%, while USO is the most bearish mover at -2.01%. The split between marginally firm defensive ETFs and weaker oil and bitcoin exposure remains Mixed versus equities.
Futures Indices – Higher Time Frame Analysis
Summary of the current state of US Indices Futures based on higher time-frame (HTF) technical analysis as of: 2026-07-27: 07:16 CT.
US Indices Futures
- ES: YSFG/WSFG above F0%, MSFG below F0%; 7693.50 resistance, 7302.50 pivot-next; benchmarks rising long-term, daily intermediate structure remains DTrend.
- NQ: YSFG/WSFG above F0%, MSFG below F0%; 28212.50 support, 30901.50-31090.00 resistance; short/intermediate benchmarks and pivots remain downward.
- YM: YSFG/MSFG/WSFG above F0%; 53668-53856 resistance, 51720 support, 52844 reversal pivot; rising 55/100/200-day benchmarks maintain broader UTrend.
- EMD: YSFG/WSFG above F0%, MSFG below F0%; 3892.4-3904.7 resistance, 3863.2 pivot-next; daily UTrend holds above rising benchmarks.
- RTY: YSFG/WSFG above F0%, MSFG below F0%; 3068.4 resistance, 2936.2 support, 3023.7 reversal pivot; daily consolidation contrasts with weekly UTrend.
- FDAX: YSFG/MSFG/WSFG above F0%; 25630-26064 resistance, 24902-24715 support; all benchmarks rising, daily and weekly pivot structures remain UTrend.
Overall State
- Short-Term: Bullish
- Intermediate-Term: Neutral
- Long-Term: Bullish
Conclusion
Long-term directional correlation remains upward across all contracts, supported by YSFG positioning and rising 100/200-period benchmarks. FDAX, YM, and EMD retain broad alignment, while ES, NQ, and RTY show MSFG-based retracement or consolidation. NQ remains the principal short- and intermediate-term lagging structure; pivot resistance contains several advances.
Note: Intra-day counter-trend pullbacks or retracements may occur, HTF is context for informational usage and market structure. Glossary: Session Fib Grids periods of YSFG:’Yearly’, MSFG:’Monthly’, WSFG:’Weekly’
For full details visit: AlphaWebTrader Technicals
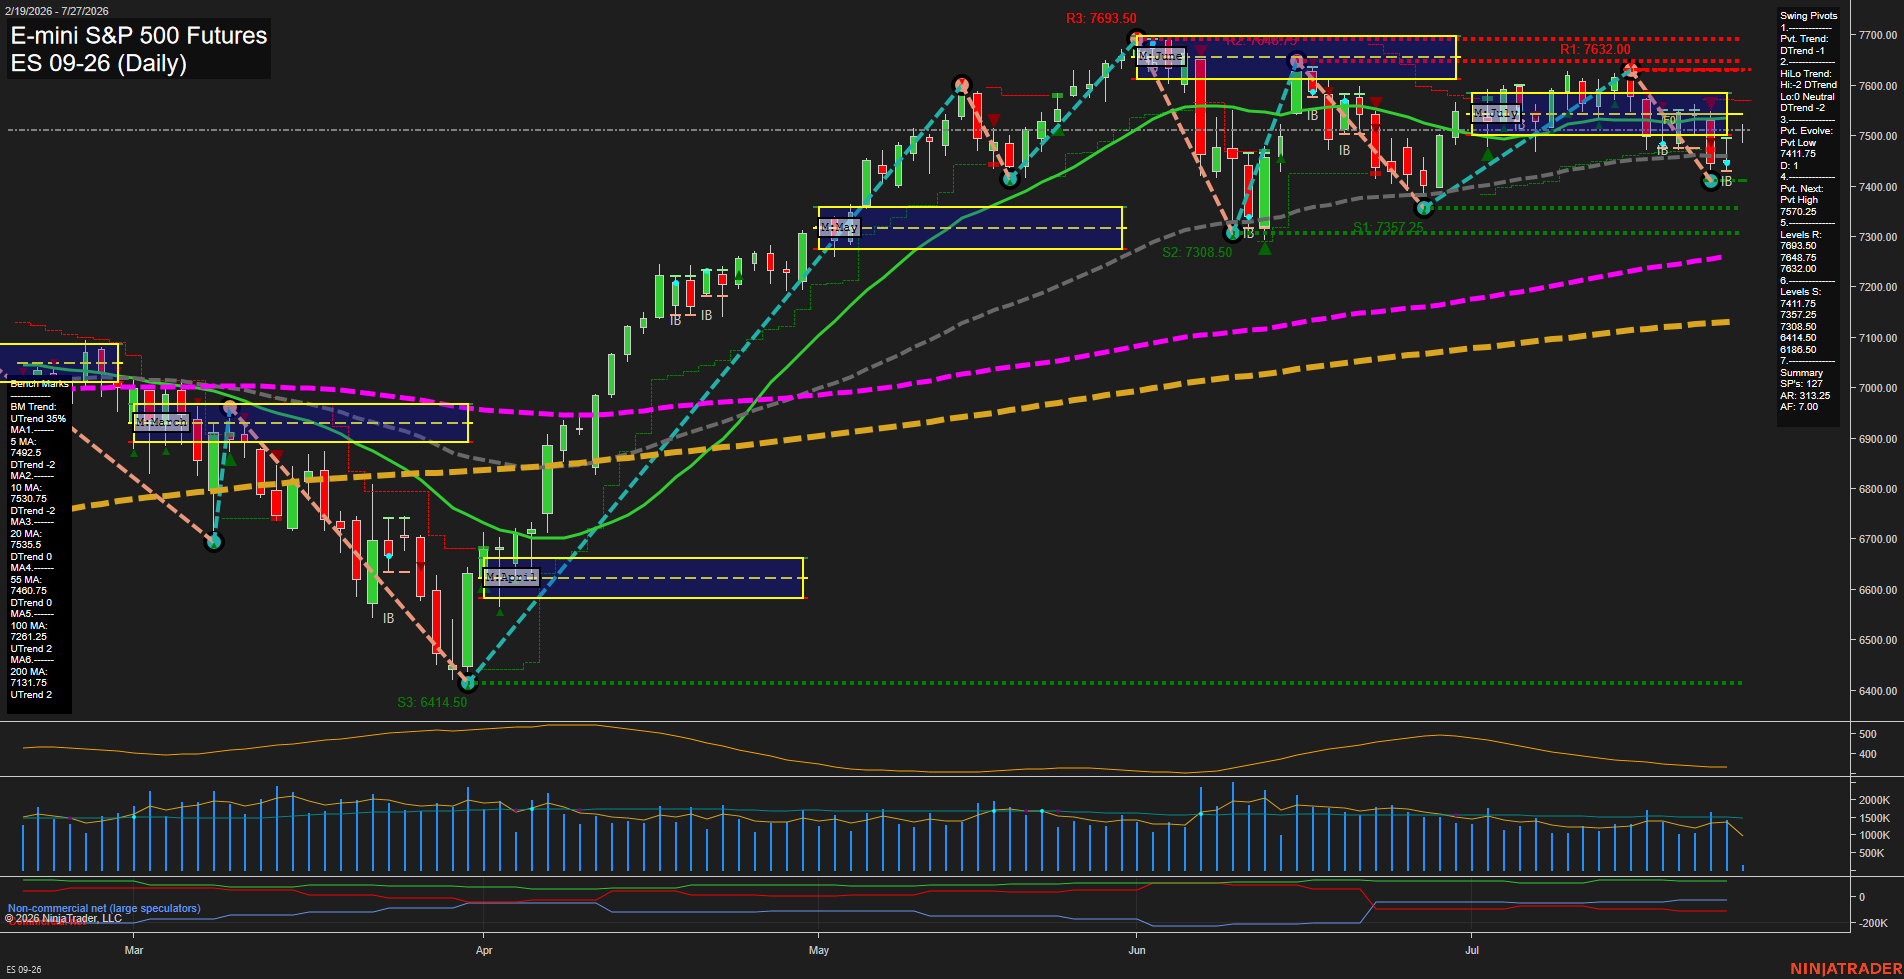
ES Daily View
Overall Rating
- Short-Term: Bullish
- Intermediate-Term: Bearish
- Long-Term: Bullish.
Key Insights Summary
Price is holding above the weekly F0% area and the rising 5-day benchmark, reflecting a short-term rebound from the 7417.5 pivot low. The recovery remains a countertrend swing within a softer intermediate structure: price is below the monthly F0% area, the 10-day and 20-day averages, and both pivot trend measures remain in DTrend. The 7530.75 to 7579.25 area defines the nearby overhead pivot and moving-average cluster, while 7411.75 and 7357.25 mark the principal lower swing supports. Long-term structure remains constructive because price is materially above rising 100-day and 200-day benchmarks, despite current consolidation and elevated daily range conditions.
View charts on: AlphaWebTrader HTF Charts
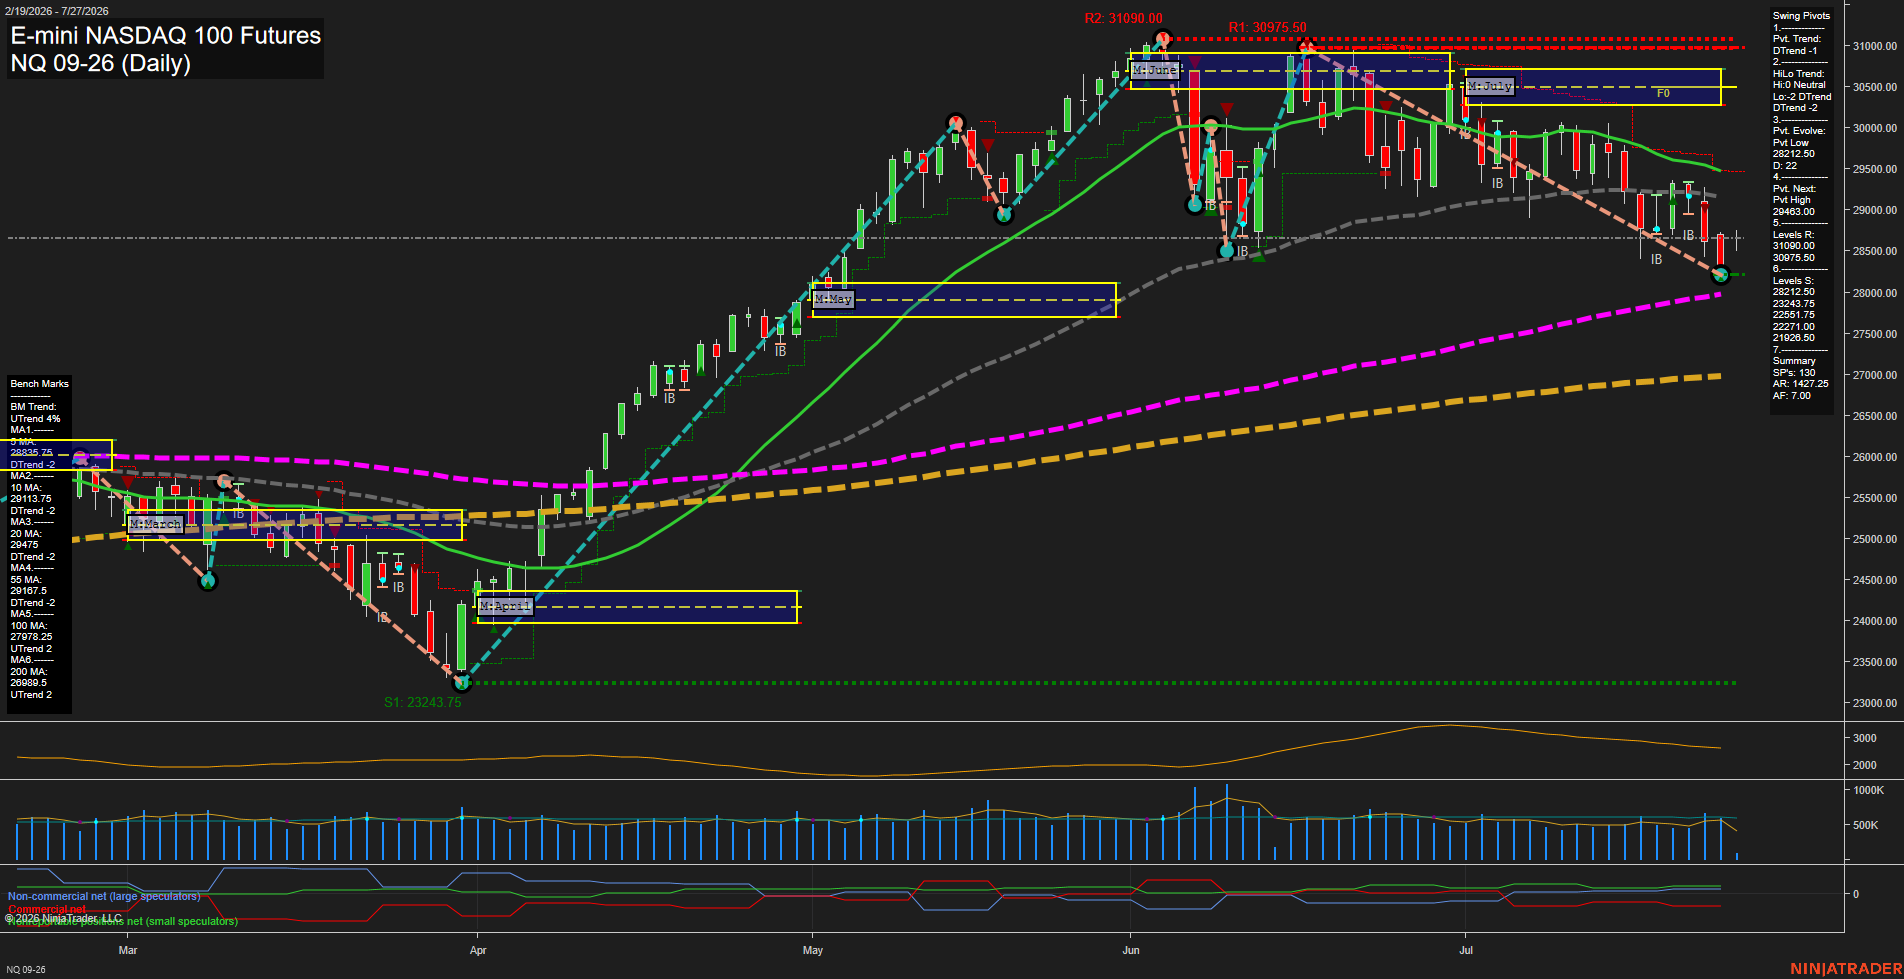
NQ Daily View
Overall Rating
- Short-Term: Bearish
- Intermediate-Term: Bearish
- Long-Term: Bullish.
Key Insights Summary
Price remains in a short-term corrective downswing, holding below the 5-, 10-, 20-, and 55-day benchmarks while the pivot sequence reflects lower highs and lower lows. The July MSFG is below its F0% region and supports the intermediate bearish retracement theme, although the weekly grid remains positive and indicates a countertrend bounce framework within the broader decline. The 28242.50 pivot-support area is the nearest structural reference beneath price, while 29463.00 is the active pivot-reversal threshold and aligns with the declining intermediate moving-average zone. The longer-term structure remains constructive because price is above the rising 100- and 200-day averages and the yearly fib grid remains positive; current action therefore reflects a pullback within a broader long-term advance rather than a confirmed major-trend reversal.
View charts on: AlphaWebTrader HTF Charts
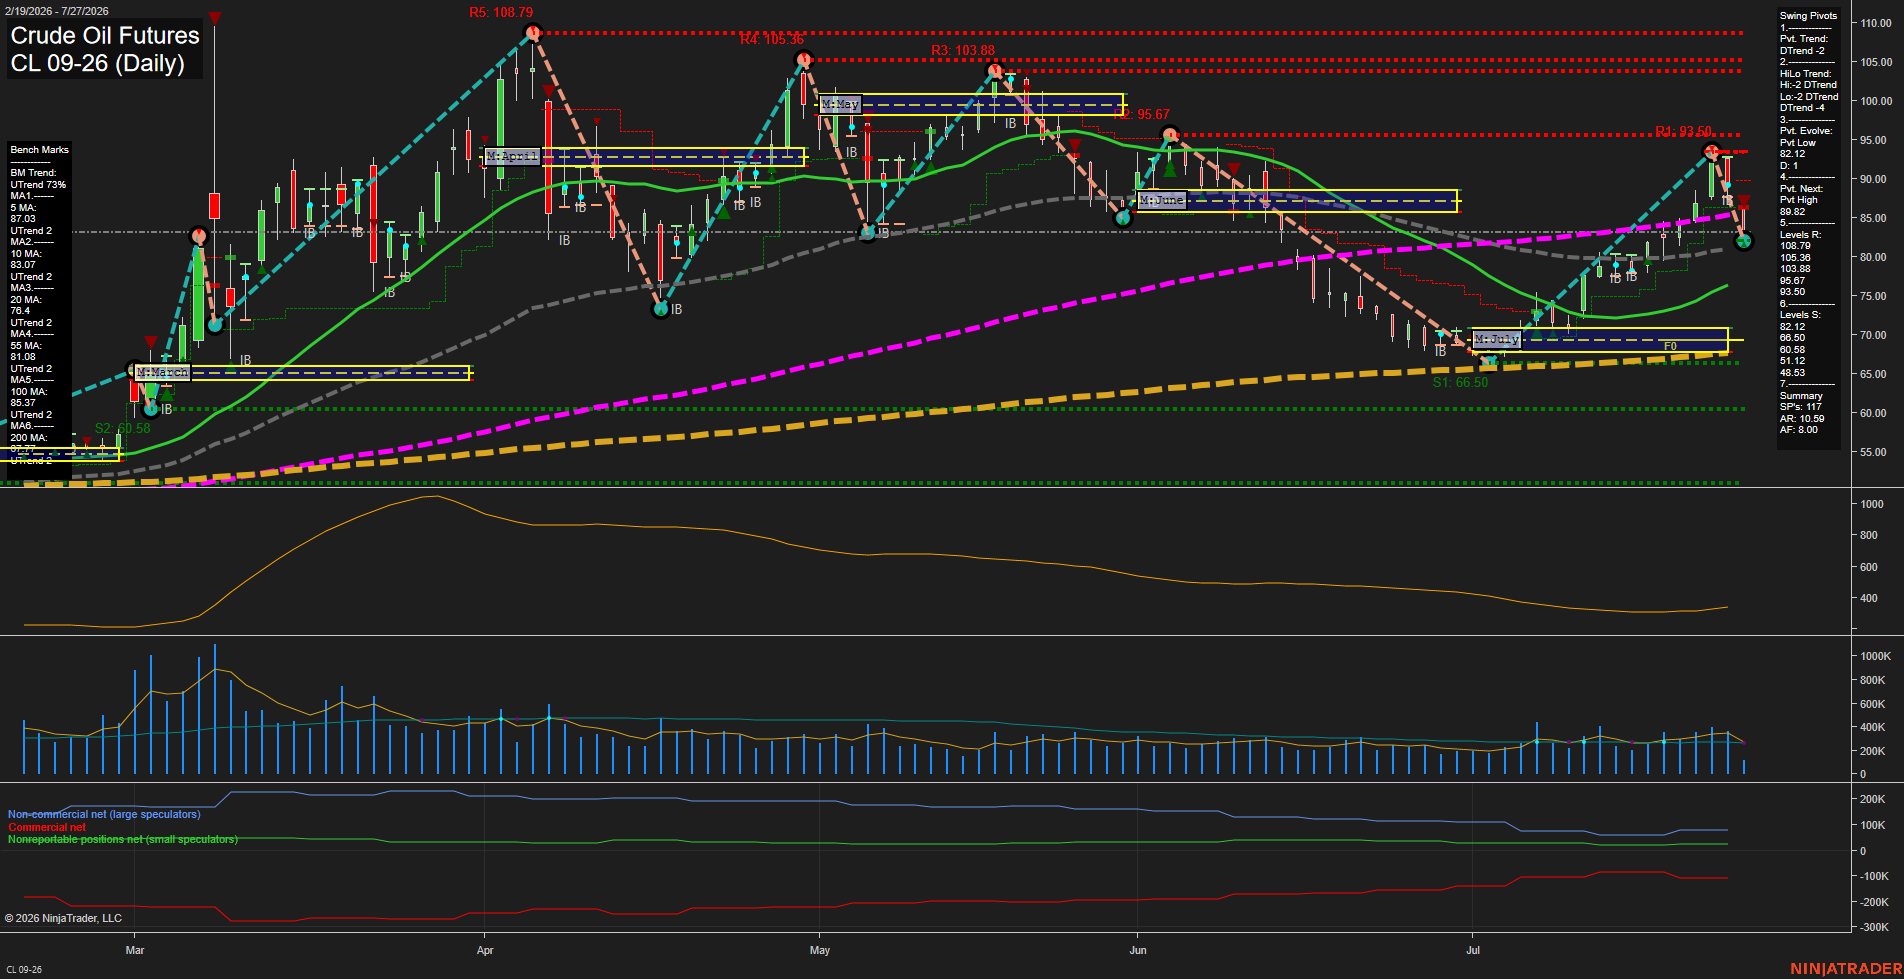
CL Daily View
Overall Rating
- Short-Term: Bearish
- Intermediate-Term: Bullish
- Long-Term: Bullish.
Key Insights Summary
Price is undergoing a fast short-term pullback after rejection from the 93.50 pivot resistance area. The current pivot and HiLo structures remain in DTrend, while the weekly Fib Grid is below its F0% level, reflecting near-term downside pressure. Price remains above the rising 10-, 20-, 55-, 100-, and 200-day benchmarks, and the monthly and yearly Fib Grid readings remain positive, preserving the broader recovery structure. The 82.12 pivot low is the principal nearby structural support, while 89.89 is the reversal level required to establish the next pivot high; 93.50 remains the larger overhead resistance reference.
View charts on: AlphaWebTrader HTF Charts
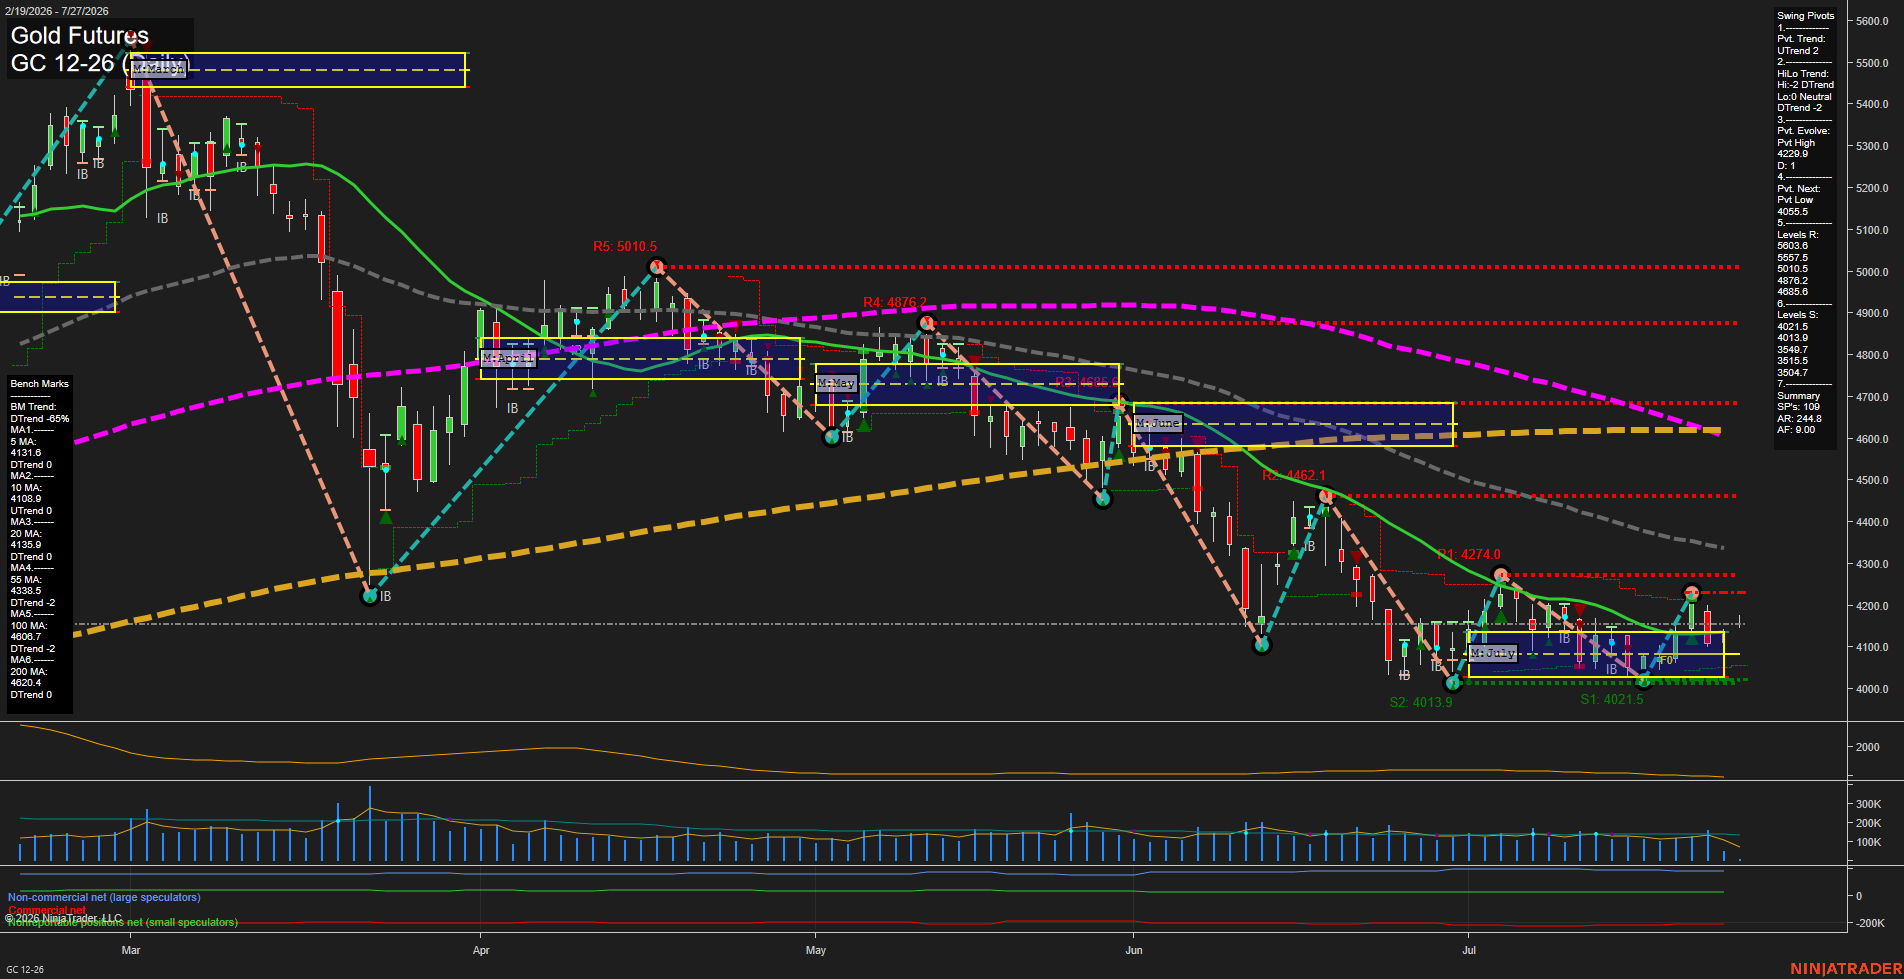
GC Daily View
Overall Rating
- Short-Term: Bullish
- Intermediate-Term: Bearish
- Long-Term: Bearish.
Key Insights Summary
GC is consolidating in a narrow July range above the 4021.5-4013.9 support cluster, with small daily bars and subdued momentum reflecting compression after the June-July decline. Short-term structure has improved to a UTrend, supported by price above the weekly and monthly F0% areas and rising 10-day benchmark behavior. The intermediate and major trend backdrop remains bearish: the HiLo trend is down and price remains beneath the declining 20-, 55-, 100-, and 200-day benchmarks. The 4229.9 pivot high is the immediate structural ceiling, while 4055.5 identifies the reversal threshold for a new short-term pivot low. Volume is below earlier-period activity, consistent with consolidation rather than a broad directional expansion.
View charts on: AlphaWebTrader HTF Charts