NYSE pre-market radar tracks ETF movers and index futures as technology weakness pressures Nasdaq futures ahead of Fed and earnings events this week.
Fundamentals: Technology and semiconductor weakness weighed on Asian equities and Nasdaq futures, while Dow futures gained as investors rotated toward blue chips. Markets monitored U.S.-Iran discussions, falling oil prices and Hormuz supply risks ahead of the Fed decision. Microsoft, Meta, Apple and Amazon earnings, GDP and PCE inflation remained key events on the calendar.
Technicals: Pre-market attention centers on gains in GOOG, MSFT and AAPL, while NVDA, TSLA and USO lagged in the prior session. ES and NQ technical structures remain bearish in the short and intermediate term, though longer-term trends stay constructive. YM and FDAX retain broader bullish alignment, while RTY and EMD consolidate below recent resistance levels.
Pre-Market Trading 360° view Market Radar of: holidays, earnings, eco-news, market-news summary, news sentiment, prior session major ETFs, MAG7, Higher Time Frame Analysis Indices Futures Summary, and E-mini S&P500, Nasdaq 100, NYMEX Crude, Gold Futures Daily Chart analysis.
As of: July 28, 2026 07:16 CT
Earnings Radar
Monitoring for earnings releases by the Magnificent 7, AI-tech-related firms, and major financial institutions.
- AAPL Release: 2026-07-30 T:AMC
- AMZN Release: 2026-07-30 T:AMC
- META Release: 2026-07-29 T:AMC
- MSFT Release: 2026-07-29 T:AMC
Conclusion: S&P 500 and Nasdaq futures face concentrated after-hours earnings catalysts from MSFT and META on July 29, followed by AAPL and AMZN on July 30. Their results and post-release price reactions provide major index-level market-impact context; market momentum and volume can slow ahead of these major tech earnings releases.
For full details visit: Yahoo Earnings Calendar
EcoNews Radar U.S. Events
| Day | Time | Impact | Event |
|---|---|---|---|
| Tue | 10:00 | Medium | CB Consumer Confidence |
| Wed | 10:30 | Low | Crude Oil Inventories |
| Wed | 14:00 | High | Federal Funds Rate |
| Wed | 14:00 | High | FOMC Statement |
| Wed | 14:30 | High | FOMC Press Conference |
| Thu | 08:30 | High | Advance GDP q/q |
| Thu | 08:30 | High | Core PCE Price Index m/m |
| Thu | 08:30 | Medium | Advance GDP Price Index q/q |
| Thu | 08:30 | Medium | Unemployment Claims |
| Fri | 08:30 | Medium | Employment Cost Index q/q |
| Fri | 10:00 | Medium | Revised UoM Consumer Sentiment |
| Fri | 10:00 | Medium | Revised UoM Inflation Expectations |
EcoNews Summary
The week centers on Wednesday’s Federal Reserve policy decisions and communications, followed by Thursday’s Advance GDP and Core PCE inflation data. These releases provide key context on interest-rate policy, economic growth, and underlying inflation. Wednesday’s crude oil inventories report is relevant for energy prices and petroleum supply conditions.
Event Notes:
- Wednesday 10:30 – Crude Oil Inventories: Measures the weekly change in U.S. commercial crude oil stockpiles. Energy markets monitor inventory draws or builds as indicators of petroleum supply-demand balance and potential pressure on crude prices.
- Wednesday 14:00 – Federal Funds Rate: The Federal Reserve’s announced target range for overnight interest rates. Equity-index futures monitor the decision for its direct relationship to financial conditions, borrowing costs, and policy direction.
- Wednesday 14:00 – FOMC Statement: The Federal Open Market Committee’s policy statement outlining its rate decision, economic assessment, and balance-sheet stance. Traders assess the language for changes in the policy outlook.
- Wednesday 14:30 – FOMC Press Conference: Federal Reserve Chair remarks and question-and-answer session following the policy announcement. Markets monitor details on the Committee’s inflation, growth, and rate-policy views.
- Thursday 08:30 – Advance GDP q/q: The first estimate of quarterly U.S. economic growth, measuring the annualized change in inflation-adjusted gross domestic product. It is monitored as a broad measure of economic activity.
- Thursday 08:30 – Core PCE Price Index m/m: Measures monthly inflation in personal consumption expenditures excluding food and energy. The Federal Reserve closely follows this gauge for underlying consumer-price pressures.
Conclusion:
The single most important event is Wednesday’s 14:00 Federal Funds Rate decision and accompanying FOMC Statement, followed by the 14:30 press conference. Market momentum and volume often slow ahead of major FOMC, PCE, and GDP releases, with increased volatility at release time. Thursday’s GDP and Core PCE reports extend the focus toward growth and inflation conditions, while crude inventories provide energy-price and petroleum-supply context.
For full details visit: Forex Factory EcoNews
Market News Summary:
Index futures reflected a split risk tone as technology-led weakness offset gains in blue chips ahead of major policy, macroeconomic, and earnings events.
Primary Drivers & Risks:
- Primary Driver: AI spending concerns pressure technology
- Primary Risk: Fed decision and Iran negotiations
Tone:
Cautious and mixed, with technology weakness dominating broad risk sentiment.
Stock Market / ETFs / Indices:
Asian equities declined, led by South Korean shares and chipmakers, after weakness in U.S. technology stocks. Concerns centered on AI-investment spending, Nvidia-related circular-deal jitters, and Chinese chipmaking competition. Nasdaq futures fell more than 1%, while Dow futures rose 0.6% and S&P 500 futures edged down 0.1%, signaling a rotation toward blue chips.
Geopolitical:
U.S.-Iran fighting remained paused for a third day as diplomatic discussions continued. Trump described “deep talks” and a chance of a deal, while stating that conflict would resume if negotiations failed. Middle East escalation and Hormuz supply concerns remained active cross-currents.
Oil / Energy:
Brent and WTI extended losses as the pause in U.S.-Iran hostilities raised hopes for normalized Middle East energy flows and a Hormuz reopening. Oil fell more than 2% in one report after earlier declines, though OPEC+ production decisions, weak demand, and regional supply risks remained in focus. Australia also considered a first new domestic refinery in more than 60 years to strengthen energy security.
Gold / Metals:
Gold declined in Asian trade amid elevated global yields and volatile oil prices. ETF inflows and central-bank buying continued to provide support, while markets focused on the Fed decision. Metals shares also contributed to the Nikkei’s decline.
Fed / Financials:
The Fed’s July meeting carried unusual uncertainty under Chairman Kevin Warsh’s limited communication approach. CME FedWatch pricing showed a 62%–65% probability of a July hold, with the balance assigned to a rate increase. The Bank of Japan was set to assess the impact of its recent rate increase.
Macro / Other:
Wednesday’s FOMC decision precedes Microsoft and Meta results, while Thursday brings advance Q2 GDP, June PCE inflation, and Apple and Amazon earnings. Sika upgraded its 2026 local-currency sales-growth outlook to 3%–6%, while Orange lifted guidance following revenue growth across Africa, the Middle East, and Europe.
Conclusion:
Technology and semiconductor weakness drove the risk-off tone across Asian equities and Nasdaq futures. The Fed decision, large-cap technology earnings, GDP, and PCE inflation formed the immediate calendar focus.
Falling oil prices eased an earlier geopolitical energy shock as U.S.-Iran talks continued. Iran-related escalation risk, Hormuz supply concerns, OPEC+ decisions, elevated yields, and uncertainty around AI spending remained key cross-currents.
Market News Sentiment
Market News Articles: 42
- Neutral: 57.14%
- Positive: 21.43%
- Negative: 21.43%
Sentiment Summary: Market news sentiment is predominantly neutral at 57%, with positive and negative coverage each at 21%.
Conclusion: Indices futures day traders are facing balanced directional news sentiment, with neutral coverage outweighing both positive and negative articles.
GLD,Gold Articles: 9
- Positive: 77.78%
- Negative: 11.11%
- Neutral: 11.11%
Sentiment Summary: GLD and gold coverage is 78% positive, 11% negative, and 11% neutral across 9 articles.
Conclusion: Gold-related news sentiment is predominantly positive, indicating a favorable tone in the coverage relevant to indices futures traders.
USO,Oil Articles: 13
- Negative: 53.85%
- Neutral: 30.77%
- Positive: 15.38%
Sentiment Summary: USO/Oil coverage is predominantly negative (54%), with 31% neutral and 15% positive.
Conclusion: Oil-related news tone is negative overall, which is a relevant cross-market sentiment input for indices futures day traders.
Market Data Snapshot
ETF Snapshot of major stock market ETFs, Mag7, and others as of: July 28, 2026 07:16
Top Movers & Losers
- GOOG 326.57 Bullish 2.34% ▲
- MSFT 389.10 Bullish 1.94% ▲
- AAPL 336.91 Bullish 1.17% ▲
- TSLA 309.22 Bearish -1.22% ▼
- NVDA 196.51 Bearish -4.99% ▼
- USO 124.76 Bearish -8.73% ▼
Major Index ETFs: SPY, QQQ, DIA, IWM, IJH
- IWM 292.91 Bullish 0.60% ▲
- DIA 521.26 Bullish 0.48% ▲
- IJH 76.00 Bullish 0.30% ▲
- SPY 739.09 Bullish 0.02% ▲
- QQQ 682.12 Bearish -0.31% ▼
Mixed index ETF snapshot: IWM is the most bullish mover at +0.60%, followed by DIA at +0.48% and IJH at +0.30%. SPY is marginally Bullish at +0.02%, while QQQ is the most bearish mover at -0.31%.
Mag 7 Stocks: AAPL, MSFT, GOOG, AMZN, META, NVDA, TSLA
- GOOG 326.57 Bullish 2.34% ▲
- MSFT 389.10 Bullish 1.94% ▲
- AAPL 336.91 Bullish 1.17% ▲
- META 593.87 Bearish -0.22% ▼
- AMZN 231.39 Bearish -0.31% ▼
- TSLA 309.22 Bearish -1.22% ▼
- NVDA 196.51 Bearish -4.99% ▼
Mag7 is Mixed: GOOG is the most bullish mover at +2.34%, followed by MSFT at +1.94% and AAPL at +1.17%. NVDA is the most bearish mover at -4.99%, with TSLA also Bearish at -1.22%; META at -0.22% and AMZN at -0.31% are modestly Bearish.
Cross-Market ETFs: TLT, GLD, USO, IBIT
- IBIT 36.77 Bullish 1.16% ▲
- GLD 374.63 Bullish 0.73% ▲
- TLT 83.75 Bullish 0.60% ▲
- USO 124.76 Bearish -8.73% ▼
Mixed cross-market snapshot: IBIT is the most bullish mover at +1.16%, followed by GLD at +0.73% and TLT at +0.60%. USO is the most bearish mover, down -8.73%.
ETF, Mag7, and Cross-Market ETF Insights
Overall Tone
Mixed conditions: broad equity ETFs are marginal to Bullish while major technology dispersion and sharp USO weakness temper the tone.
Equity ETFs and Mag7:
Major Index ETFs are broadly Mixed, with IWM leading at +0.60%, followed by DIA at +0.48% and IJH at +0.30%; SPY is near-flat at +0.02%, while QQQ is Bearish at -0.31%. Mag7 participation is selective: GOOG is the most bullish mover at +2.34%, ahead of MSFT at +1.94%, while NVDA is the most bearish mover at -4.99% and TSLA declines -1.22%. AAPL gains +1.17%, while META falls -0.22% and AMZN falls -0.31%, underscoring selective rather than fully aligned equity strength.
Cross-Market ETFs:
Cross-market ETFs are Mixed, led by IBIT as the most bullish mover at +1.16%, with GLD up +0.73% and TLT up +0.60%. USO is the most bearish mover at -8.73%, creating pronounced commodity weakness despite gains in bonds, gold, and bitcoin exposure. This divergence contrasts with the marginal-to-Bullish broad equity ETF performance.
Futures Indices – Higher Time Frame Analysis
Summary of the current state of US Indices Futures based on higher time-frame (HTF) technical analysis as of: 2026-07-28: 07:16 CT.
US Indices Futures
- ES YSFG up; MSFG/WSFG below F0%, pivots down, 7300 support/7693.50 resistance; below 5–55D, above rising 100/200D.
- NQ YSFG up; MSFG/WSFG below F0%, DTrend, 27892.50 support/30562.50–31090 resistance; below short benchmarks, above rising 55–200W.
- YM YSFG/MSFG/WSFG above F0%, higher pivots, 51184 support/53656 resistance; above rising benchmark averages, daily compression beneath highs.
- EMD YSFG up; MSFG/WSFG below F0%, pullback below 3892.4; 3724.0–3692.9 support, 3847.2–3892.4 resistance; above rising 20–200D.
- RTY YSFG/WSFG above F0%, MSFG below F0%, short pivots down; 2931.1 support/3011.1–3068.4 resistance; above rising 100/200D.
- FDAX YSFG/MSFG/WSFG above F0%, higher pivots, 24920 support/25610–26064 resistance; above all rising benchmark averages.
Overall State
- Short-Term: Bearish
- Intermediate-Term: Neutral
- Long-Term: Bullish
Conclusion
ES, NQ, EMD, and RTY retain short-term retracement structures, with MSFG and/or WSFG positioning below F0% and nearby pivot support defining current downside references. YM and FDAX maintain stronger benchmark and grid alignment, though YM is consolidating below 53656. Across all instruments, YSFG context and rising long-term benchmarks retain an upward long-term correlation; ES, NQ, and RTY remain the weaker short-term components.
Note: Intra-day counter-trend pullbacks or retracements may occur, HTF is context for informational usage and market structure. Glossary: Session Fib Grids periods of YSFG:’Yearly’, MSFG:’Monthly’, WSFG:’Weekly’
For full details visit: AlphaWebTrader Technicals
ES Daily View
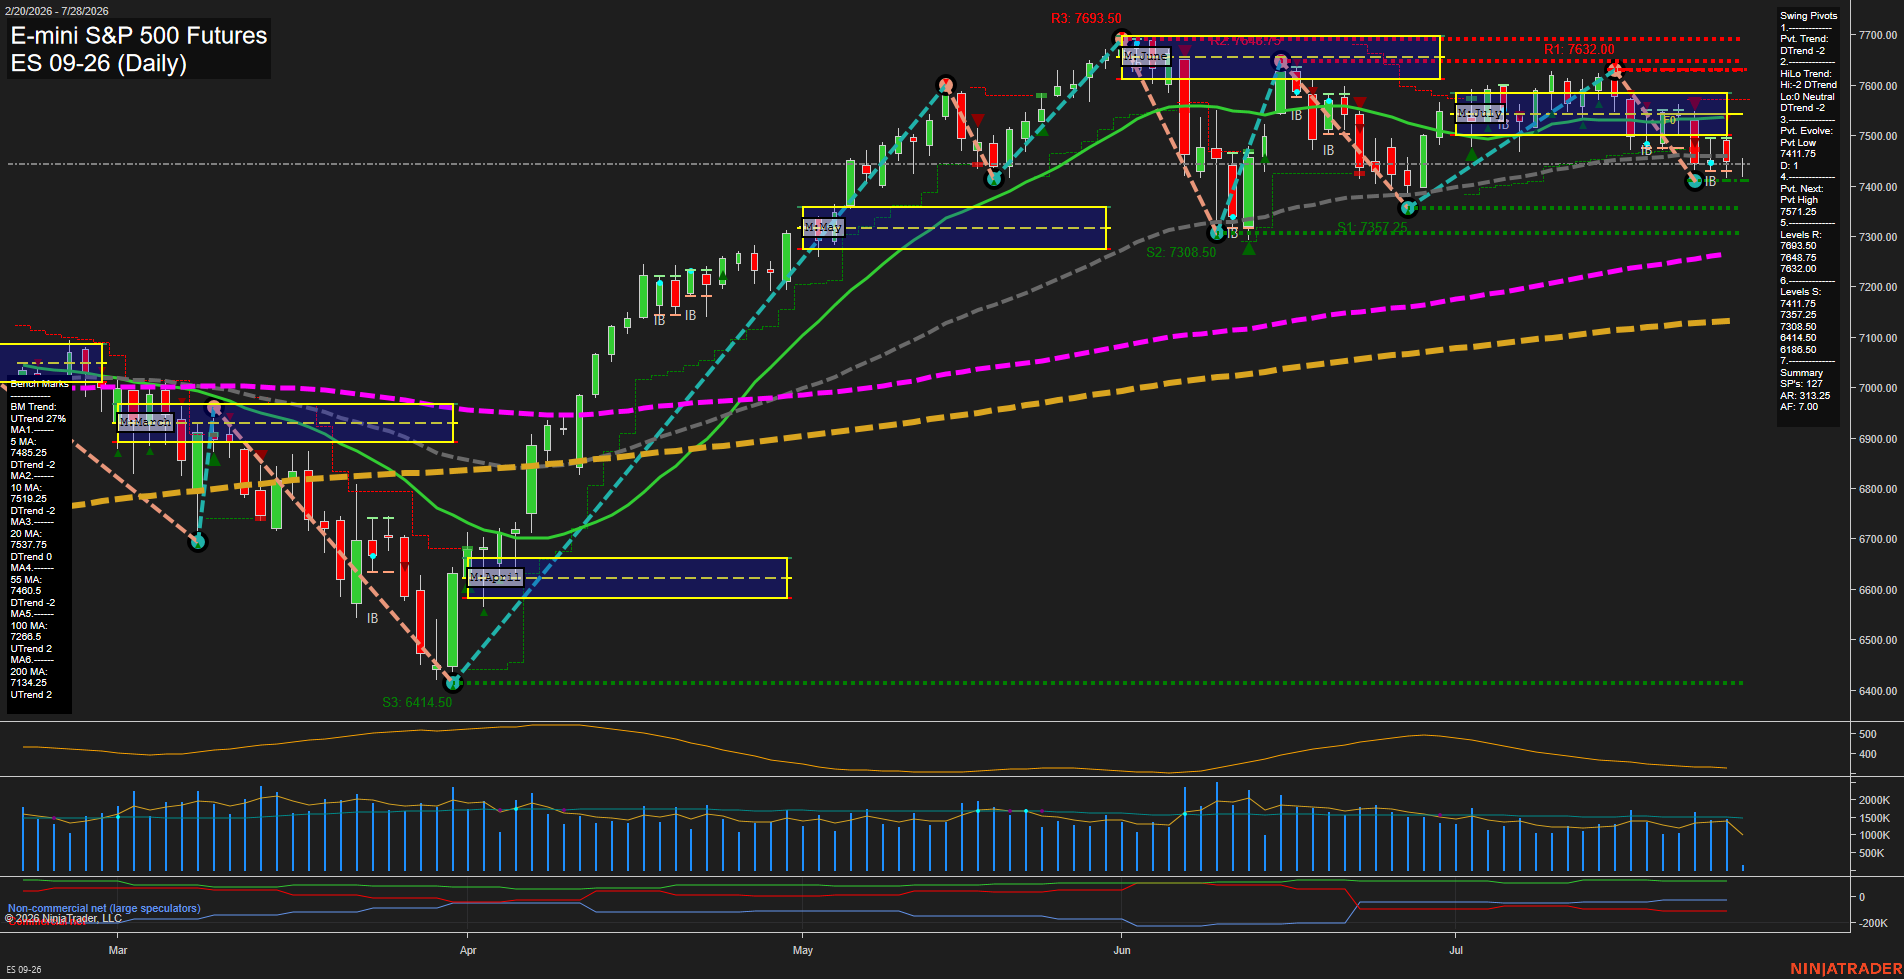
Overall Rating
- Short-Term: Bearish
- Intermediate-Term: Bearish
- Long-Term: Bullish.
Key Insights Summary
ES is consolidating beneath the weekly and July monthly F0% levels after a sharp decline from the mid-July 7600 area. The short-term pivot structure remains in a DTrend, with price below the 5, 10, 20, and 55-day benchmarks and recent short signals aligned with the current downside swing. Small daily bars and slowing momentum reflect compression near the 7411.75 pivot-support area, while 7357.25 and 7308.50 define the next lower support structure. The broader 2026 trend remains constructive because price is still above rising 100-day and 200-day averages, making the current decline an intermediate pullback within a longer-term uptrend.
View charts on: AlphaWebTrader HTF Charts
NQ Daily View
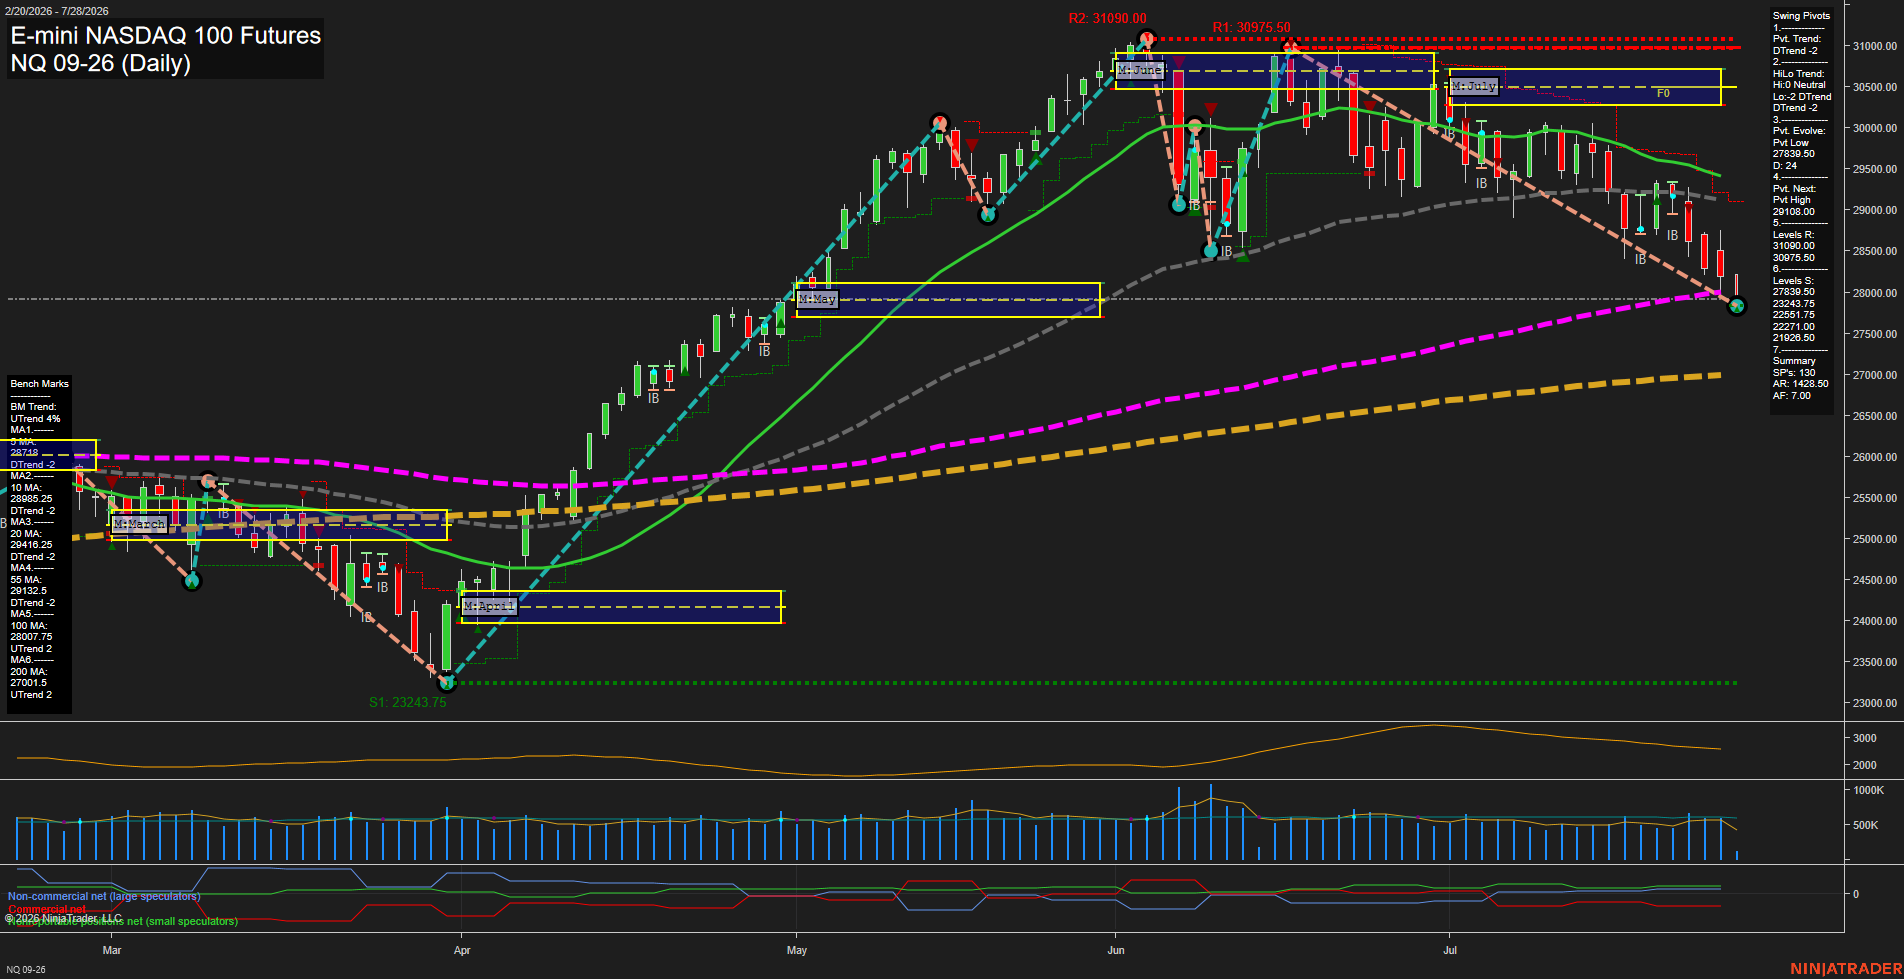
Overall Rating
- Short-Term: Bearish
- Intermediate-Term: Bearish
- Long-Term: Bullish.
Key Insights Summary
Price is in a fast short-term selloff, trading below the weekly and July monthly Fib-grid centers and beneath all short- and intermediate-term benchmarks. The daily pivot structure remains in DTrend, with the 27839.50 pivot low defining the immediate downside reference and 29018.00 the next pivot-high reversal threshold. The broader yearly structure remains constructive because price is still above rising 100-day and 200-day averages, framing the current decline as an intermediate corrective leg within a longer-term uptrend.
View charts on: AlphaWebTrader HTF Charts
CL Daily View
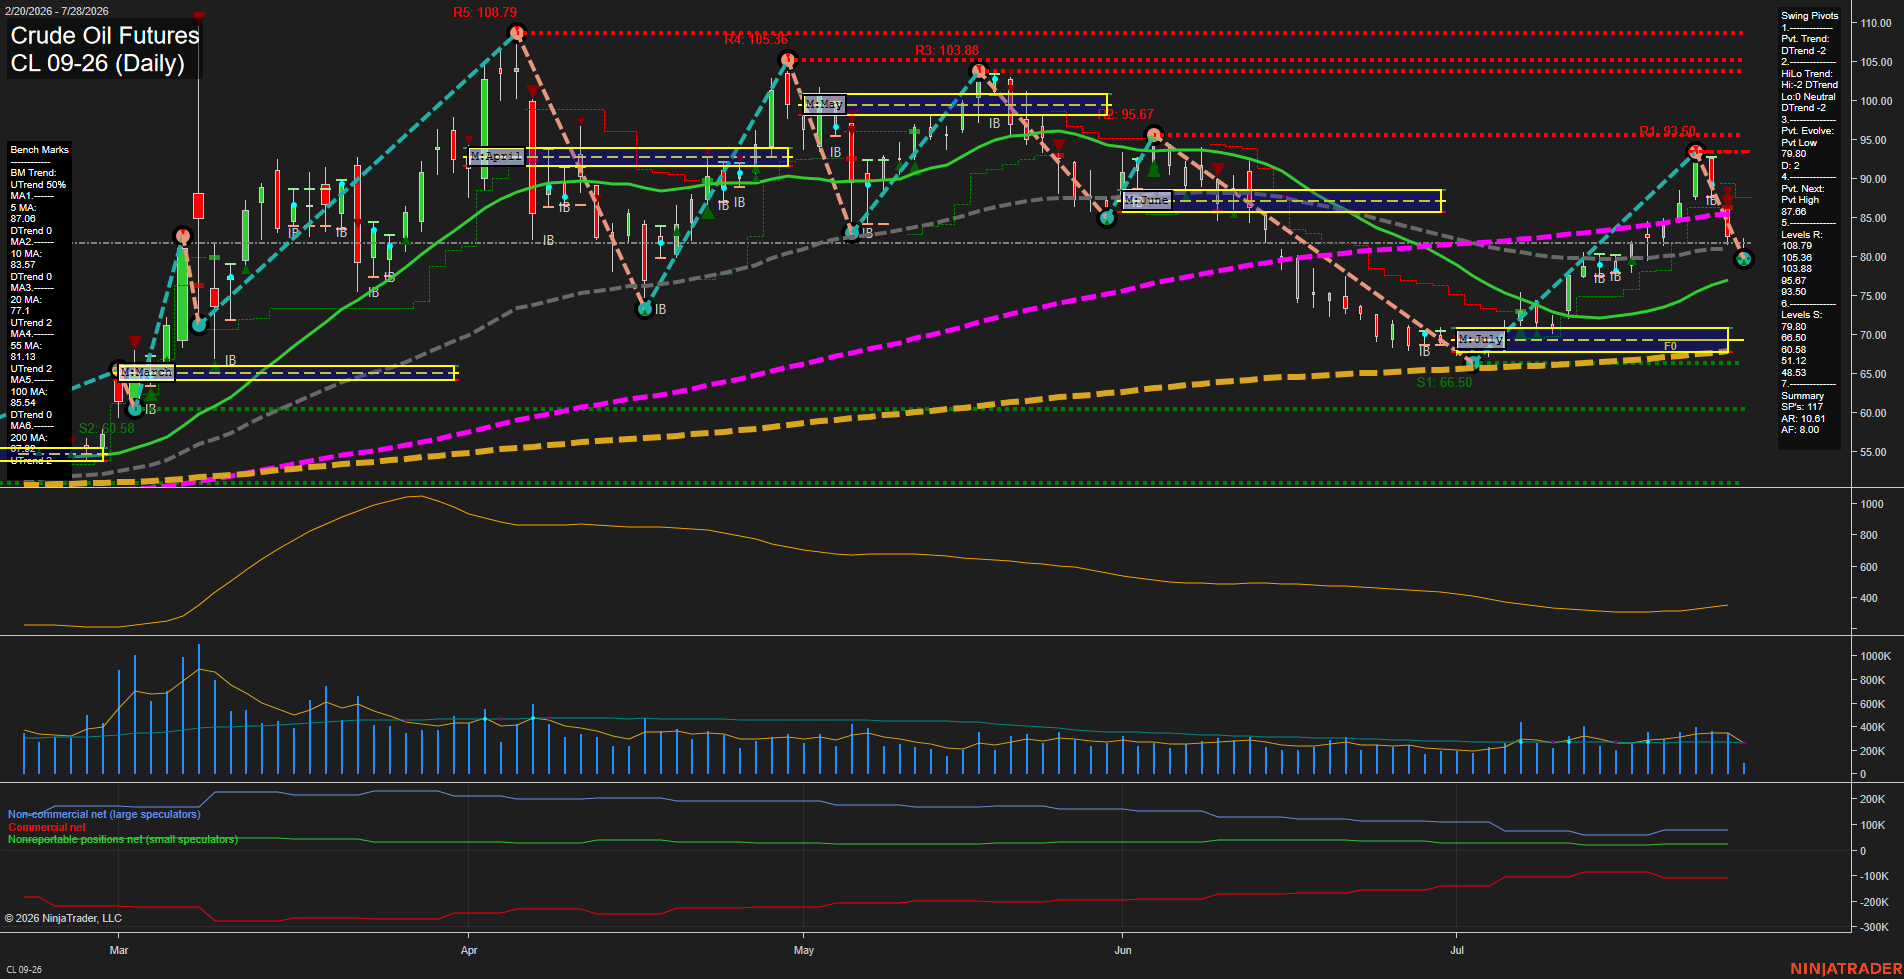
Overall Rating
- Short-Term: Bearish
- Intermediate-Term: Neutral
- Long-Term: Neutral.
Key Insights Summary
Price action has reversed sharply lower from the late-July recovery high, producing a large-range decline beneath the 5-day, 10-day, 55-day, and 100-day benchmarks. The short-term pivot structure is in DTrend, with 87.66 defining the next upside pivot reversal level and 79.80 serving as immediate pivot support. Intermediate conditions are mixed: July MSFG remains above its F0% level and the 20-day and 55-day averages retain upward trends, while the HiLo pivot trend has turned down. The broader yearly grid remains positive above F0%, but the 100-day average is declining and the recent selloff has shifted the near-term swing cycle toward lower highs and renewed downside momentum.
View charts on: AlphaWebTrader HTF Charts
GC Daily View
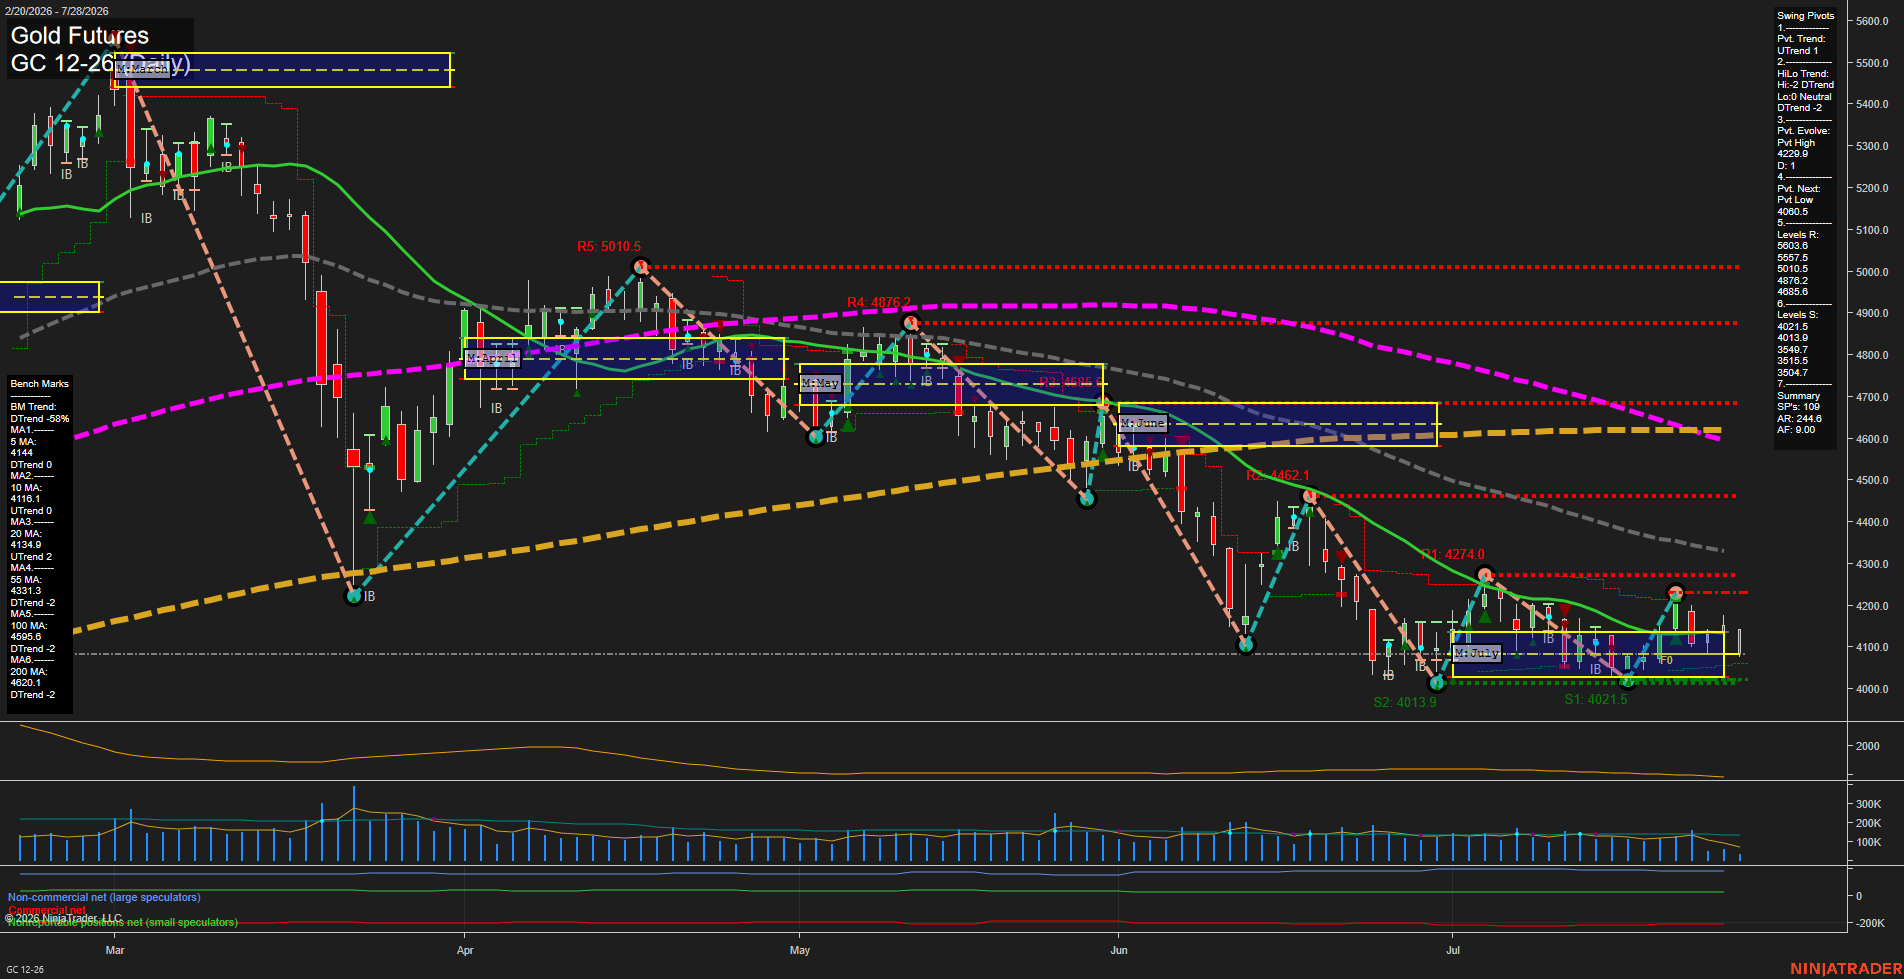
Overall Rating
- Short-Term: Bearish
- Intermediate-Term: Neutral
- Long-Term: Bearish.
Key Insights Summary
Gold is consolidating in a narrow, low-momentum range near 4106 after a broader decline from the June and early-July highs. The short-term pivot has turned up, but price remains beneath the 5-day average and the weekly fib-grid bias is down, while the developing 4228.9 pivot high defines the nearby recovery ceiling. The 4021.5-4013.9 support cluster remains the dominant lower boundary, with the next pivot reversal level at 4060.5. Intermediate structure is mixed: July MSFG remains positive and the 20-day average is rising, but the HiLo trend and 55-day average remain down. Long-term conditions retain a bearish alignment, with price materially below the declining 100-day and 200-day benchmarks. Volume is subdued relative to earlier swings, consistent with consolidation rather than a high-participation directional expansion.
View charts on: AlphaWebTrader HTF Charts