Stocks fell as Iran tensions lifted oil and Treasury yields surged after the Fed decision, pushing the Nasdaq 100 sharply into correction territory.
Fundamentals: U.S. equities retreated broadly as renewed Iran conflict concerns drove Brent crude above $90 a barrel and heightened inflation risks. Treasury yields climbed after the Fed held rates steady while three officials favored an increase, with the 30-year yield reaching its highest level since 2007. Energy shares gained, but technology-led benchmarks weakened amid scrutiny of AI earnings assumptions.
Technicals: USO surged as GOOG and GLD posted modest gains, while DIA, Tesla and Nvidia declined. Futures analysis showed short-term bearish conditions for S&P 500 and Nasdaq contracts, with daily charts under pressure following recent highs. Dow, DAX and E-mini S&P structures retained broader strength, while Russell 2000 consolidated within its longer-term uptrend.
After Market Close daily snapshot: market news summary and sentiment, major ETFs, Magnificent 7 analysis, Indices Futures Higher Time Frame Analysis, and E-mini S&P500, Nasdaq 100, NYMEX Crude, Gold Futures Daily Chart analysis.
As of: July 29, 2026 05:00 CT
Market News Summary:
Equity futures context turned risk-off as U.S.-Iran tensions lifted crude prices while Fed-related yield concerns intensified the stock sell-off.
Primary Drivers & Risks:
- Primary Driver: Iran escalation lifts crude prices
- Primary Risk: Surging yields and inflation concerns
Tone:
Risk-off, with energy strength offset by broad equity pressure.
Stock Market / ETFs / Indices:
Stocks slid sharply, with the Dow down 850 points at midday and later falling more than 2%. The S&P 500 reached four-week lows, while the Nasdaq 100 moved more than 10% below prior records and entered correction territory. Individual investors recorded their largest net selling of single stocks since the COVID-era crash, while attention also centered on upcoming Microsoft and Meta earnings and AI infrastructure spending.
Geopolitical:
Iran launched a missile attack on U.S. forces in Jordan, ending a ceasefire lull and prompting pledges of a severe U.S. response. The U.S. military was reported to be escorting oil and gas shipments through the Strait as the conflict tightened Middle East supply conditions.
Oil / Energy:
Crude oil spiked about 7%, with Brent rising above $90 per barrel after the Iranian attack. U.S. oil-linked shares advanced, and Middle East supply disruption supported rerouting of Canadian crude toward Japan.
Gold / Metals:
Gold and silver faced conflicting signals: one assessment described rangebound prices with a downward bias amid hawkish Fed messaging, while technical commentary cited gold holding key support and bullion demand showed improvement, including digital precious-metals demand.
Fed / Financials:
The Fed held rates steady, but three officials backed an increase, highlighting policy divisions. Chairman Kevin Warsh’s inflation posture coincided with a sharp rise in Treasury yields; the 30-year yield reached its highest level since 2007 and government borrowing costs hit a two-decade high.
Macro / Other:
AI-related earnings assumptions remained under scrutiny, with commentary citing unusually high projected EPS growth, elevated margins, and concerns around one-off gains and circular commercial arrangements. Lennox International also declined after cutting full-year earnings guidance.
Conclusion:
The main market drivers were the Iran conflict, the associated oil-price surge, and the Fed decision’s impact on Treasury yields. These forces coincided with a broad equity retreat led by technology-heavy benchmarks.
Higher inflation concerns, retail stock selling, and questions around AI earnings assumptions added to downside pressure. Energy outperformance and mixed precious-metals signals created cross-currents within the broader risk-off session.
Market News Sentiment
Market News Articles: 47
- Neutral: 40.43%
- Negative: 31.91%
- Positive: 27.66%
Sentiment Summary: Market news sentiment is mixed-to-neutral, with 40% neutral, 32% negative, and 28% positive coverage across 47 articles.
Conclusion: Indices futures headlines show a neutral overall tone, with negative coverage modestly exceeding positive coverage.
GLD,Gold Articles: 10
- Negative: 40.00%
- Positive: 40.00%
- Neutral: 20.00%
Sentiment Summary: Gold-related coverage is balanced, with 40% positive, 40% negative, and 20% neutral articles across 10 items.
Conclusion: The gold news tone is mixed, providing no clear directional sentiment signal for indices futures day traders.
USO,Oil Articles: 13
- Positive: 53.85%
- Negative: 30.77%
- Neutral: 15.38%
Sentiment Summary: USO/Oil coverage is moderately positive, with 54% positive, 31% negative, and 15% neutral articles across 13 items.
Conclusion: Oil-related news tone is net positive but includes a meaningful share of negative coverage for indices futures day traders to monitor.
Market Data Snapshot
ETF Snapshot of major stock market ETFs, Mag7, and others as of: July 29, 2026 05:00
Top Movers & Losers
- USO 129.31 Bullish 7.32% ▲
- GOOG 335.76 Bullish 0.95% ▲
- GLD 371.08 Bullish 0.46% ▲
- DIA 515.41 Bearish -2.18% ▼
- TSLA 298.32 Bearish -2.97% ▼
- NVDA 190.01 Bearish -3.55% ▼
Major Index ETFs: SPY, QQQ, DIA, IWM, IJH
- SPY 729.46 Bearish -1.54% ▼
- IWM 288.57 Bearish -1.64% ▼
- IJH 74.73 Bearish -1.71% ▼
- QQQ 661.73 Bearish -2.04% ▼
- DIA 515.41 Bearish -2.18% ▼
Major Index ETFs were uniformly Bearish: DIA led losses at -2.18%, followed by QQQ at -2.04%. IJH declined -1.71% and IWM fell -1.64%, while SPY was the least negative mover at -1.54%.
Mag 7 Stocks: AAPL, MSFT, GOOG, AMZN, META, NVDA, TSLA
- GOOG 335.76 Bullish 0.95% ▲
- AAPL 338.19 Bearish -0.56% ▼
- MSFT 390.54 Bearish -0.71% ▼
- META 585.61 Bearish -1.31% ▼
- AMZN 226.65 Bearish -1.82% ▼
- TSLA 298.32 Bearish -2.97% ▼
- NVDA 190.01 Bearish -3.55% ▼
Mag7 was Bearish overall: GOOG was the most bullish mover at +0.95%, while NVDA was the most bearish mover at -3.55%. Selling extended through TSLA at -2.97%, AMZN at -1.82%, META at -1.31%, MSFT at -0.71%, and AAPL at -0.56%.
Cross-Market ETFs: TLT, GLD, USO, IBIT
- USO 129.31 Bullish 7.32% ▲
- GLD 371.08 Bullish 0.46% ▲
- IBIT 36.00 Bearish -0.39% ▼
- TLT 82.85 Bearish -1.65% ▼
Mixed cross-market context: USO is the most bullish mover at +7.32%, while GLD is also Bullish at +0.46%. TLT is the most bearish mover at -1.65%, and IBIT is Bearish but comparatively contained at -0.39%.
ETF, Mag7, and Cross-Market ETF Insights
Overall Tone
Bearish risk-off tone: broad equity ETF weakness coincided with pressure across most Mag7 names, while USO strength diverged sharply.
Equity ETFs and Mag7:
Major Index ETFs were broadly Bearish, led lower by DIA at -2.18%, QQQ at -2.04%, IJH at -1.71%, IWM at -1.64%, and SPY at -1.54%; SPY was the least negative index ETF. Mag7 action was selective but predominantly Bearish: GOOG was the only bullish name at +0.95%, while NVDA was the most bearish mover at -3.55%, followed by TSLA at -2.97%; AAPL at -0.56% and MSFT at -0.71% were comparatively less negative.
Cross-Market ETFs:
Cross-market action was Mixed, with USO the most bullish mover at +7.32% and GLD also Bullish at +0.46%, showing commodity strength against equity weakness. TLT was the most bearish cross-market ETF at -1.65%, while IBIT was modestly Bearish at -0.39%.
Futures Indices – Higher Time Frame Analysis
Summary of the current state of US Indices Futures based on higher time-frame (HTF) technical analysis as of: 2026-07-29: 17:00 CT.
US Indices Futures
- ES YSFG above, MSFG/WSFG below F0%, daily DTrend; 7519.25 resistance, 7411.75/7375.25 support, 7300.00 weekly pivot, 7693.50 swing high.
- NQ YSFG above, MSFG/WSFG below; lower daily pivots beneath benchmarks through 100-day, 27603.50 support, 28880.50 reversal pivot, 31090.00 resistance.
- YM YSFG/MSFG/WSFG above F0%, UTrend across pivots and rising benchmarks; 53105/53656 resistance, 51961-51720 pivot and 55-day support.
- EMD YSFG above, MSFG/WSFG below F0%; daily UTrend above benchmarks, 3892.4 resistance, 3724.0/3692.9 support, 3662.0 weekly reversal pivot.
- RTY YSFG/WSFG above, MSFG below F0%; weekly UTrend, daily pullback below 10/20-day, 2931.7 support, 3017.9 reversal pivot, 3068.4 resistance.
- FDAX YSFG/MSFG/WSFG above F0%, benchmarks rising and daily UTrend; 25676/26064 resistance, 25214-25149 trend support, 24715 swing support.
Overall State
- Short-Term: Neutral
- Intermediate-Term: Neutral
- Long-Term: Bullish
Conclusion
Long-term structure remains aligned upward across all listed indices, supported by yearly Fib-grid positioning and rising longer-term benchmarks. ES and NQ retain bearish daily and weekly momentum, with RTY in a daily corrective phase. YM and FDAX maintain aligned bullish pivot and benchmark structures; EMD holds a bullish daily structure beneath swing resistance. Short-term direction is mixed across the index group, while ES, NQ, and RTY retracements contrast with YM, EMD, and FDAX relative strength.
Note: Intra-day counter-trend pullbacks or retracements may occur, HTF is context for informational usage and market structure. Glossary: Session Fib Grids periods of YSFG:’Yearly’, MSFG:’Monthly’, WSFG:’Weekly’
For full details visit: AlphaWebTrader Technicals
ES Daily View
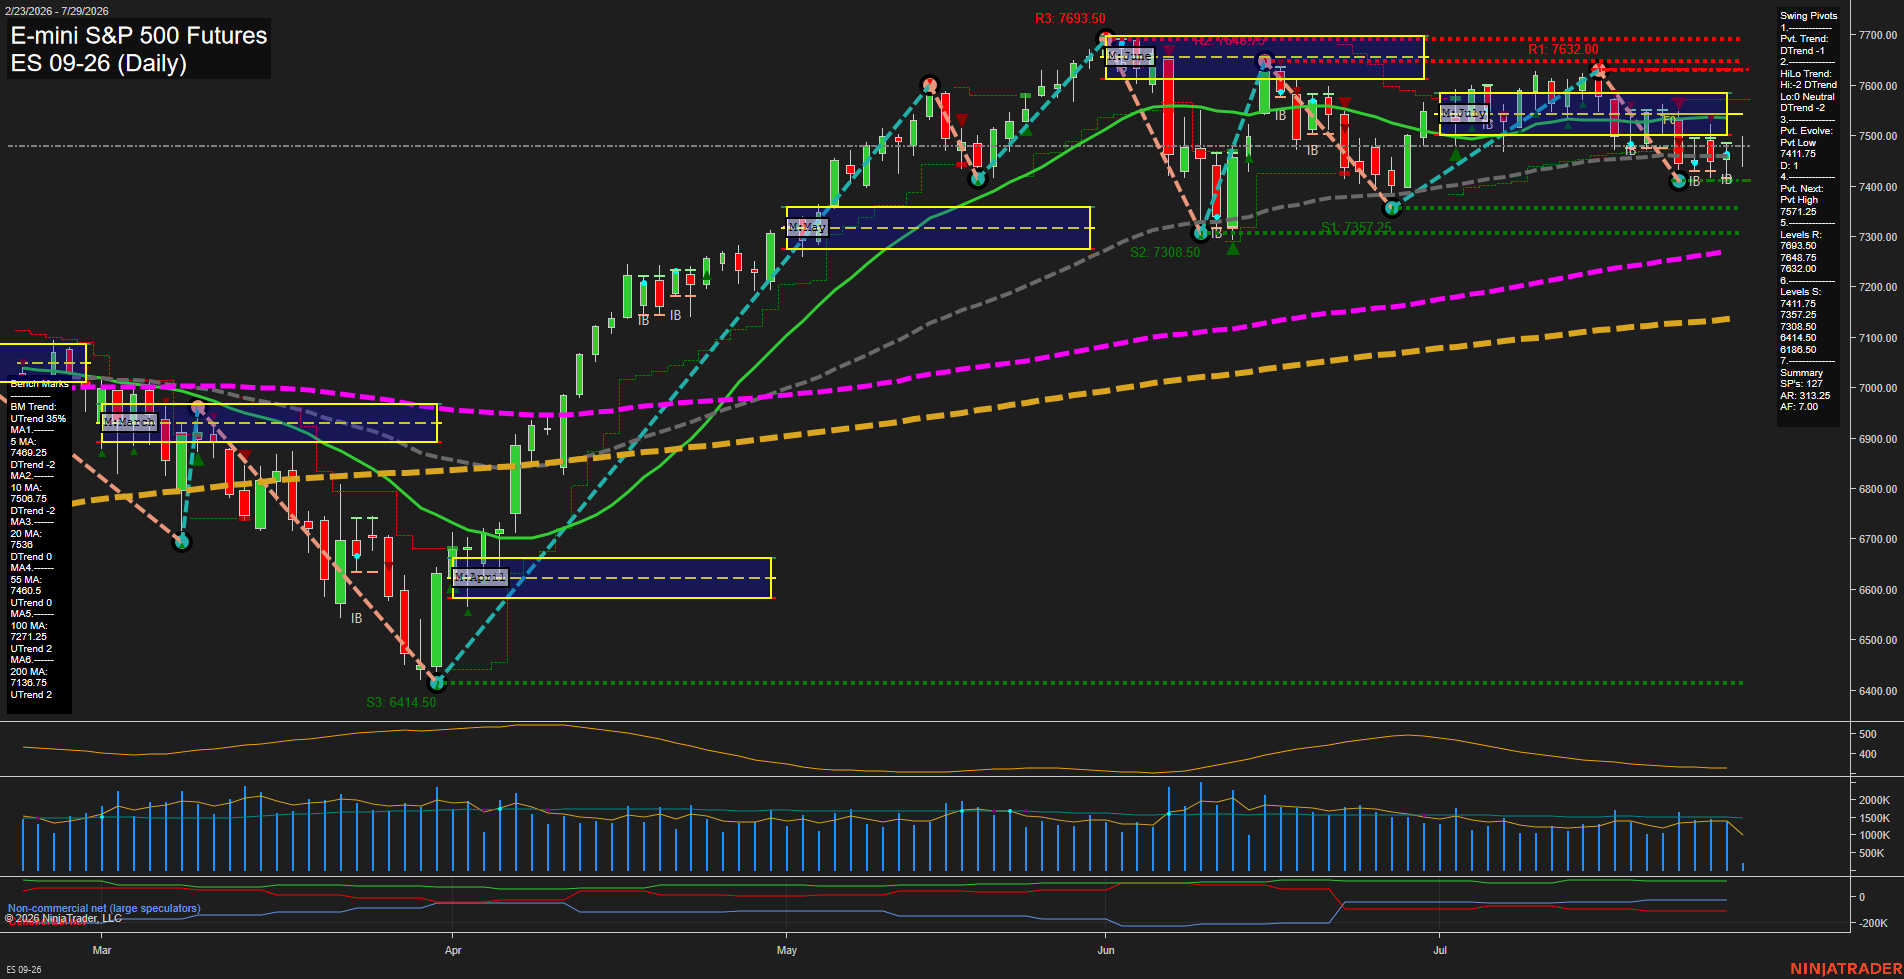
Overall Rating
- Short-Term: Bearish
- Intermediate-Term: Bearish
- Long-Term: Bullish.
Key Insights Summary
Price is consolidating near 7475 after a rejection from the July highs, with small daily bars and slow momentum reflecting a compressed, choppy pullback rather than an impulsive recovery. Short-term and monthly fib-grid conditions remain below their F0% reference areas, while the pivot structure is in DTrend and recent signals are aligned to the downside. The 7519.25 pivot threshold and the declining 10- and 20-day averages define the nearby overhead pressure zone. Support is concentrated at 7411.75 and 7375.25, followed by 7308.50. The larger 100- and 200-day benchmarks remain rising and price remains above the yearly grid, preserving the broader long-term uptrend despite the current short- and intermediate-term corrective phase.
View charts on: AlphaWebTrader HTF Charts
NQ Daily View
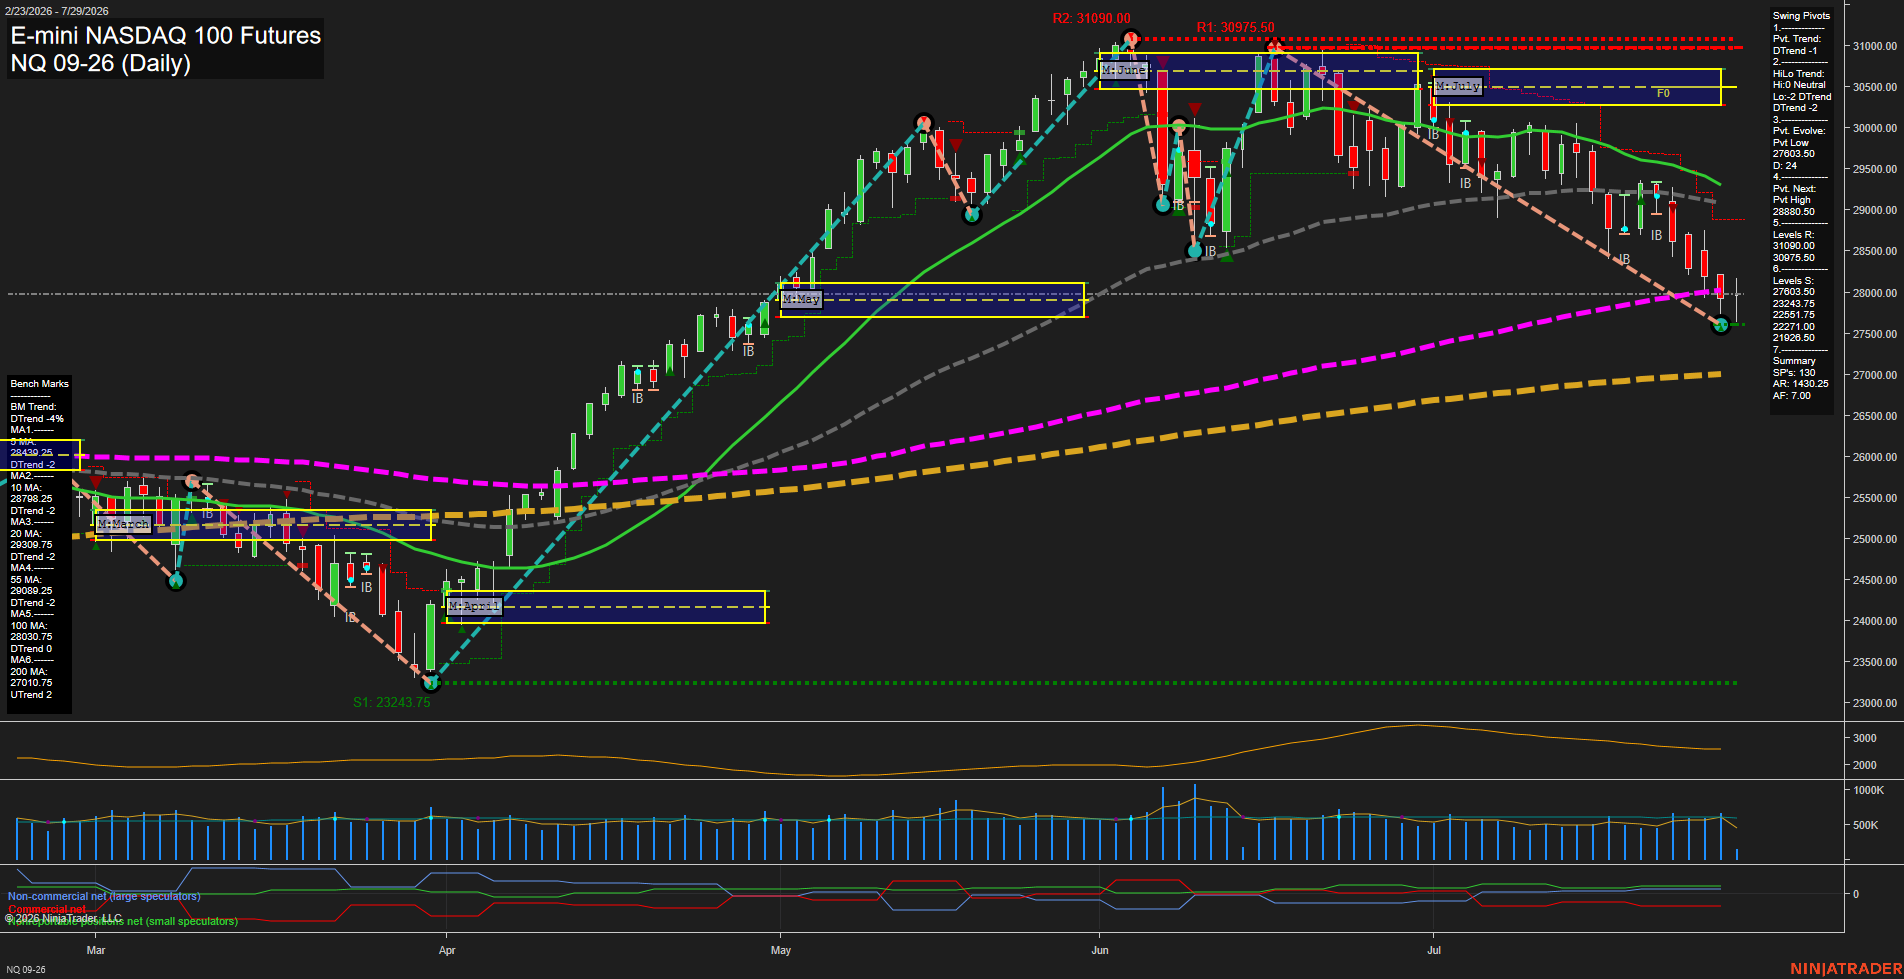
Overall Rating
- Short-Term: Bearish
- Intermediate-Term: Bearish
- Long-Term: Bullish.
Key Insights Summary
The daily structure reflects a fast, medium-range selloff from the June high, with lower highs and lower lows maintaining the short-term pivot downtrend. Price is below the weekly and July monthly Fib-grid centers and beneath all major averages through the 100-day benchmark, confirming broad short-to-intermediate-term weakness. The 27603.50 pivot low is the immediate structural support, while 28880.50 defines the next opposite-pivot reversal level. Longer-term structure remains constructive because price is above the rising 200-day average and the 2026 yearly Fib-grid trend remains up, framing the current decline as a significant countertrend retracement within the larger advance.
View charts on: AlphaWebTrader HTF Charts
CL Daily View
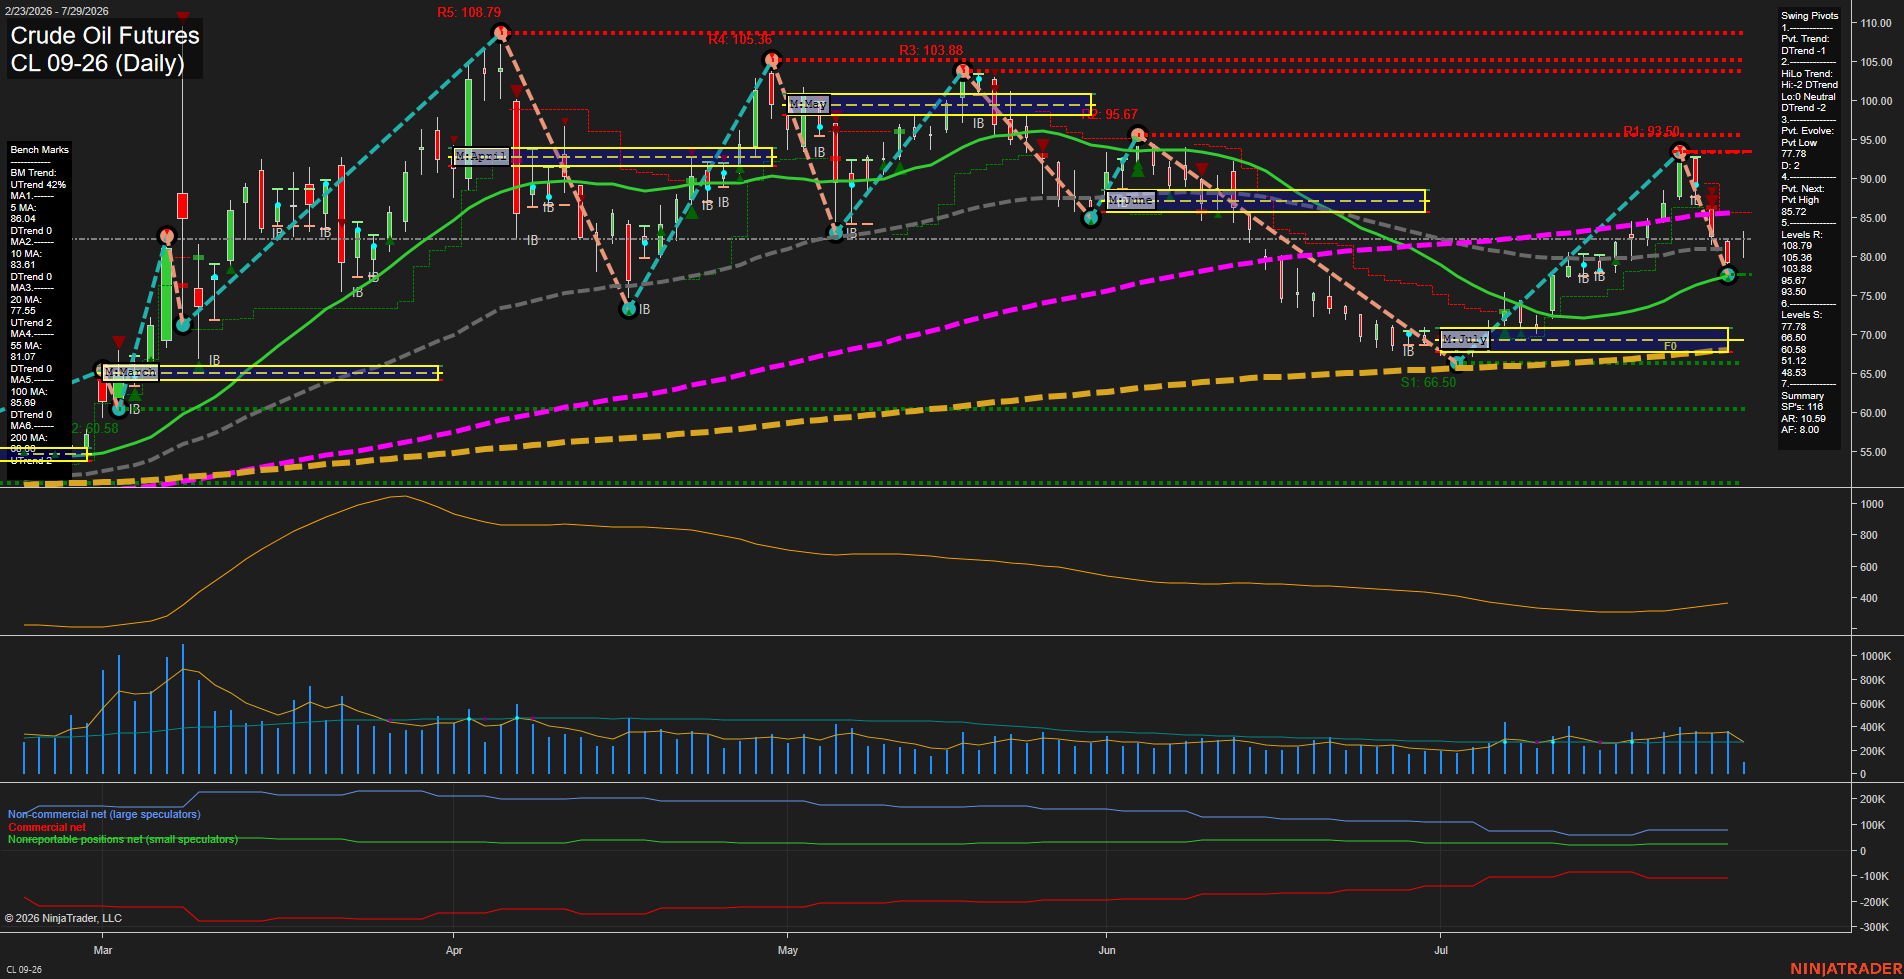
Overall Rating
- Short-Term: Bearish
- Intermediate-Term: Neutral
- Long-Term: Neutral.
Key Insights Summary
CL has shifted into a sharp short-term selloff, with price below the weekly F0% level, below the 5- and 10-day benchmarks, and a DTrend pivot structure. The decline has retraced the July recovery and is testing the active 77.78 pivot-low support area while momentum remains fast. Intermediate conditions are mixed: the monthly grid and 20-day average remain constructive, but price is below the declining 55-day average and the HiLo pivot trend remains down. Longer-term structure remains supported by price above the yearly grid and rising 200-day average, although the falling 100-day average reflects persistent overhead supply. The 85.72 pivot-next level and clustered 81.07 to 86.40 moving averages define the nearest rebound/rejection zone, while 77.78 is the immediate technical inflection level.
View charts on: AlphaWebTrader HTF Charts
GC Daily View
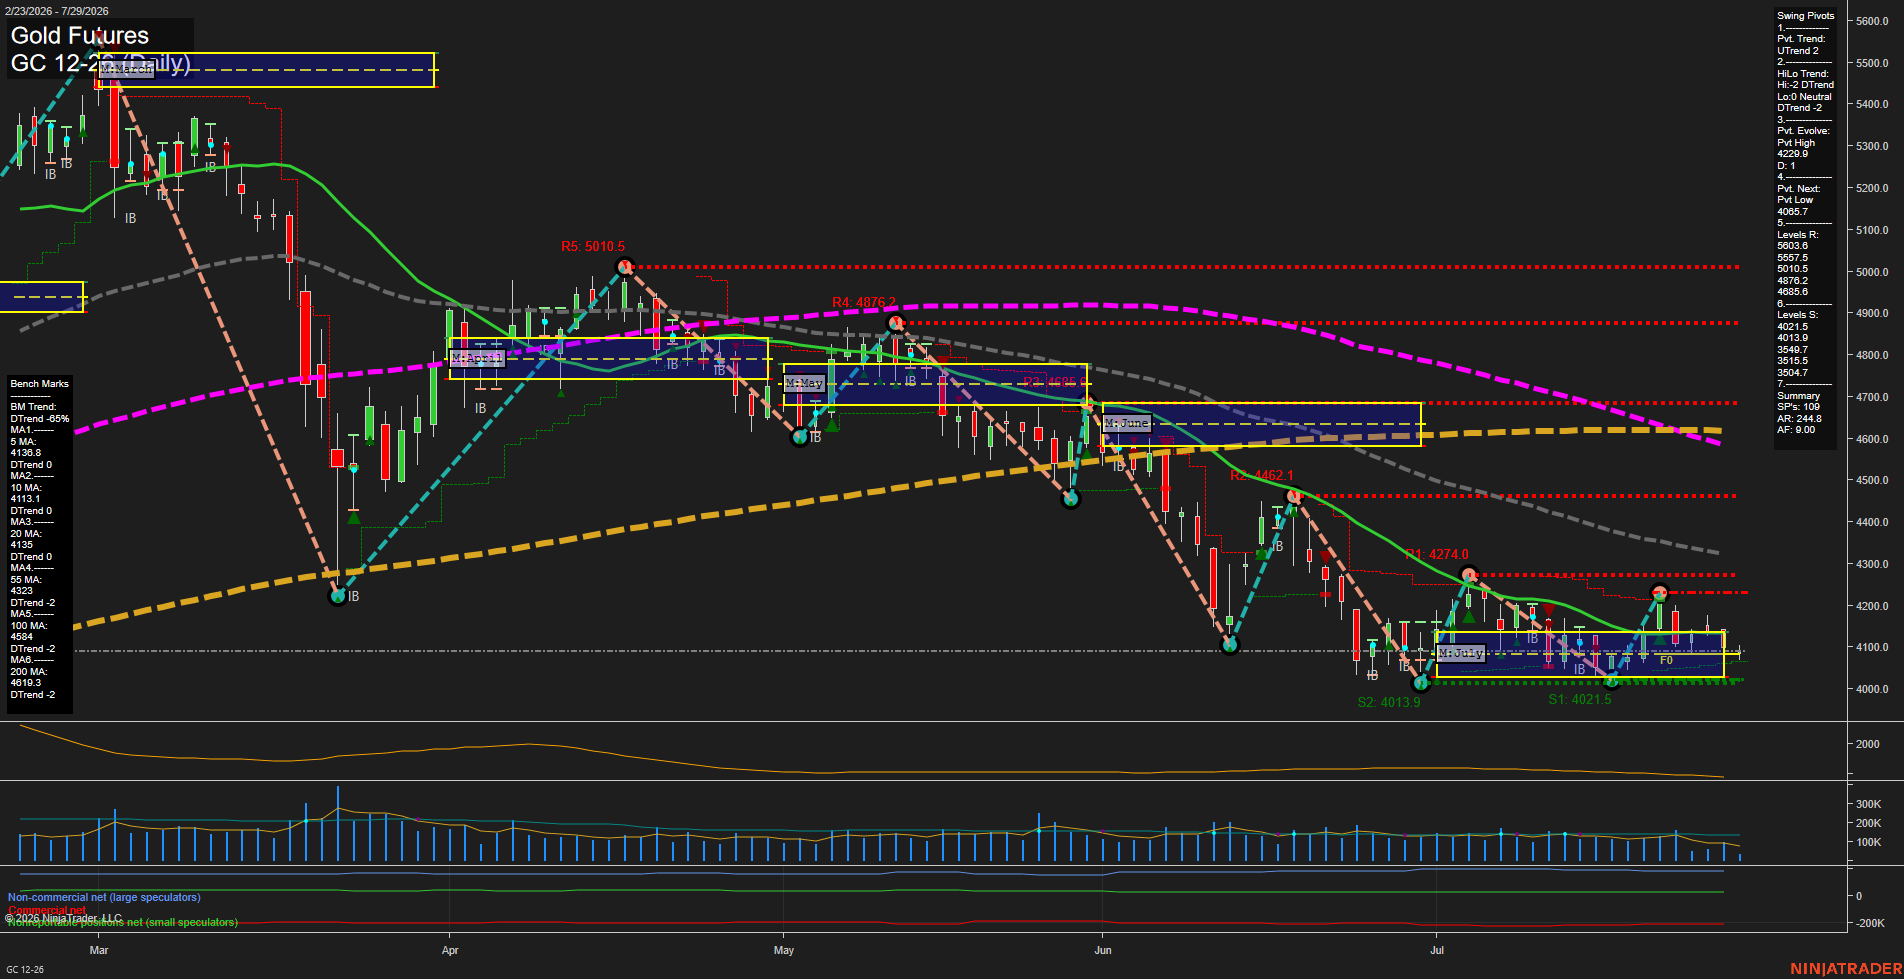
Overall Rating
- Short-Term: Bearish
- Intermediate-Term: Bearish
- Long-Term: Bearish.
Key Insights Summary
Gold is consolidating in a narrow, low-momentum range near 4106 after a sustained decline. The short-term pivot has turned upward, but price remains below the weekly F0% area and below all daily benchmarks, leaving the bounce structurally counter-trend. The 4021.5-4013.9 support band is the immediate downside reference, while 4113-4153 marks the nearby moving-average resistance zone; 4229.8 is the current pivot-high reversal level. Monthly positioning remains marginally above its F0% level, although the intermediate HiLo trend, long-term yearly grid, and 100/200-day benchmarks retain a broader bearish alignment.
View charts on: AlphaWebTrader HTF Charts