NYSE pre-market radar reviews ETF movers and futures trends as Fed policy, oil disruption, tech pressure, earnings and crude data shape focus today.
Fundamentals: Markets enter the NYSE pre-market session with attention on the Federal Reserve’s rate decision, statement and press conference. Middle East conflict has lifted oil prices and heightened energy-supply concerns, while AI-linked technology shares face valuation and credit-risk scrutiny. Earnings releases, crude inventories, elevated index valuations and weaker precious metals add to a busy event-driven session.
Technicals: Prior-session ETF leaders included GOOG, MSFT and DIA, while GLD, IBIT and USO declined. Futures technicals show short-term bearish conditions in ES and NQ amid broader long-term uptrends. YM, EMD and FDAX remain constructive across major time frames, while RTY is consolidating after its July advance.
Pre-Market Trading 360° view Market Radar of: holidays, earnings, eco-news, market-news summary, news sentiment, prior session major ETFs, MAG7, Higher Time Frame Analysis Indices Futures Summary, and E-mini S&P500, Nasdaq 100, NYMEX Crude, Gold Futures Daily Chart analysis.
As of: July 29, 2026 07:16 CT
Earnings Radar
Monitoring for earnings releases by the Magnificent 7, AI-tech-related firms, and major financial institutions.
- AAPL Release: 2026-07-30 T:AMC
- AMZN Release: 2026-07-30 T:AMC
- META Release: 2026-07-29 T:AMC
- MSFT Release: 2026-07-29 T:AMC
Conclusion: META and MSFT report after the close on July 29, followed by AAPL and AMZN after the close on July 30, concentrating MAG7 and major-tech earnings catalysts across two sessions. Market momentum and volume can slow ahead of these releases, while index futures sensitivity centers on post-release reactions and cross-sector repricing.
For full details visit: Yahoo Earnings Calendar
EcoNews Radar U.S. Events
| Day | Time | Impact | Event |
|---|---|---|---|
| Wed | 10:30 | Low | Crude Oil Inventories |
| Wed | 14:00 | High | Federal Funds Rate |
| Wed | 14:00 | High | FOMC Statement |
| Wed | 14:30 | High | FOMC Press Conference |
| Thu | 08:30 | High | Advance GDP q/q |
| Thu | 08:30 | High | Core PCE Price Index m/m |
| Thu | 08:30 | Medium | Advance GDP Price Index q/q |
| Thu | 08:30 | Medium | Unemployment Claims |
| Fri | 08:30 | Medium | Employment Cost Index q/q |
| Fri | 10:00 | Medium | Revised UoM Consumer Sentiment |
| Fri | 10:00 | Medium | Revised UoM Inflation Expectations |
EcoNews Summary
The week centers on Wednesday’s Federal Reserve policy announcements and Thursday’s simultaneous GDP and Core PCE releases. These events provide major information on interest-rate policy, economic growth, and inflation. Wednesday’s crude oil inventories report adds an energy-supply data point relevant to inflation-sensitive markets.
Event Notes:
- Wednesday 10:30 Crude Oil Inventories: Reports the weekly change in U.S. commercial crude stockpiles. Traders monitor inventories for petroleum supply conditions and their influence on energy prices and inflation concerns.
- Wednesday 14:00 Federal Funds Rate: The Federal Reserve’s policy-rate decision. It defines the target range for overnight lending rates and is monitored for its effect on financial conditions, borrowing costs, and index futures pricing.
- Wednesday 14:00 FOMC Statement: The policy statement outlines the Federal Open Market Committee’s assessment of inflation, employment, growth, and monetary policy. Markets examine its language for changes in the policy outlook.
- Wednesday 14:30 FOMC Press Conference: The Fed Chair provides context on the policy decision and answers questions. Remarks often shape market interpretation of the rate decision and statement.
- Thursday 08:30 Advance GDP q/q: The first estimate of quarterly U.S. economic growth, measured through changes in gross domestic product. It is monitored as a broad reading of economic activity.
- Thursday 08:30 Core PCE Price Index m/m: Measures monthly inflation in personal consumption expenditures excluding food and energy. It is closely monitored as an underlying inflation measure used in Federal Reserve analysis.
Conclusion:
The single most important event is Wednesday’s 14:00 FOMC Statement, alongside the Federal Funds Rate decision and subsequent press conference. Market momentum and volume often slow ahead of major FOMC, GDP, and PCE releases, with increased volatility at release time. High oil prices directly affect markets through inflation and geopolitical concerns; the crude inventories report provides a timely petroleum-supply reading.
For full details visit: Forex Factory EcoNews
Market News Summary:
Index futures face a Fed decision backdrop alongside Middle East energy disruption and renewed pressure across AI-linked technology assets.
Primary Drivers & Risks:
- Primary Driver: Fed decision and policy guidance
- Primary Risk: Middle East escalation and AI credit stress
Tone:
Cautious, with elevated event and sector-specific volatility.
Stock Market / ETFs / Indices:
AI cost concerns have weighed heavily on technology shares, while rising credit-default-swap costs for Oracle, Nvidia, and Apple debt highlight broader scrutiny of AI-related valuations and credit risk. The S&P 500 remains near record highs and historically elevated valuation levels, while commentary also flags technical correction risk. Corporate results were mixed but included solid sales or earnings updates from Hermes, VF, Ardagh Metal Packaging, Coherent, Aston Martin, and EDPR.
Geopolitical:
Fresh Middle East fighting disrupted diplomatic efforts and included U.S. interception of Iranian ballistic missiles directed at U.S. forces in Jordan. The conflict has intensified concern around regional security and energy-market stability.
Oil / Energy:
Oil prices rose more than 3% amid the new Middle East strikes and concerns over Hormuz-related diplomacy. OPEC+ is also preparing for another September production increase, while LNG supply risks and regional tensions remain in focus.
Gold / Metals:
Gold and silver remained under pressure ahead of the Fed decision, with gold testing $3,950 support and silver trading between $55 and $64. Higher yields and a hawkish monetary-policy backdrop have weighed on precious metals, while inflation at 3.5% remains a longer-term safe-haven consideration.
Fed / Financials:
Markets price in unchanged rates, but Chairman Kevin Warsh’s limited guidance has increased uncertainty around the policy statement and outlook. A stronger dollar has provided less inflation relief than anticipated, while Morgan Stanley faces allegations that mortgage staff were pressured to approve loans for wealthy clients.
Macro / Other:
AI investment is reshaping Asian air-cargo networks around semiconductor manufacturing hubs as cross-border e-commerce growth loses momentum. China’s regulator is set to address solar-industry pricing compliance and cost-accounting standards.
Conclusion:
The Fed decision and accompanying guidance are the central scheduled market catalyst. Middle East conflict has lifted oil and increased the prominence of energy-related inflation risks.
AI-sector equity and credit pressure remains a cross-current for major indices. Elevated S&P 500 valuations, precious-metals weakness, and corporate earnings updates add to session-specific volatility.
Market News Sentiment
Market News Articles: 33
- Positive: 39.39%
- Neutral: 36.36%
- Negative: 24.24%
Sentiment Summary: Of 33 market news articles, 39% were positive, 36% neutral, and 24% negative, indicating a modestly positive news tone.
Conclusion: Indices futures day traders are facing broadly mixed coverage with positive articles exceeding negative articles.
GLD,Gold Articles: 15
- Negative: 40.00%
- Neutral: 33.33%
- Positive: 26.67%
Sentiment Summary: GLD and gold coverage is predominantly negative at 40%, with 33% neutral and 27% positive articles.
Conclusion: Gold-related news tone is mixed but leans negative, which may be relevant to broader risk and inflation-sensitive market context.
USO,Oil Articles: 10
- Negative: 50.00%
- Positive: 30.00%
- Neutral: 20.00%
Sentiment Summary: USO and oil coverage is mixed but leans negative, with 50% negative, 30% positive, and 20% neutral articles.
Conclusion: For indices futures day traders, oil-related news tone is predominantly negative, while positive coverage remains a meaningful minority.
Market Data Snapshot
ETF Snapshot of major stock market ETFs, Mag7, and others as of: July 29, 2026 07:16
Top Movers & Losers
- GOOG 332.60 Bullish 1.85% ▲
- MSFT 393.35 Bullish 1.09% ▲
- DIA 526.89 Bullish 1.08% ▲
- GLD 369.37 Bearish -1.40% ▼
- IBIT 36.14 Bearish -1.71% ▼
- USO 120.49 Bearish -3.42% ▼
Major Index ETFs: SPY, QQQ, DIA, IWM, IJH
- DIA 526.89 Bullish 1.08% ▲
- SPY 740.86 Bullish 0.24% ▲
- IWM 293.37 Bullish 0.16% ▲
- IJH 76.03 Bullish 0.04% ▲
- QQQ 675.49 Bearish -0.97% ▼
Mixed index ETF snapshot: DIA is the most bullish mover at +1.08%, while QQQ is the most bearish mover at -0.97%. SPY +0.24% and IWM +0.16% are Bullish, while IJH is marginally Bullish at +0.04%.
Mag 7 Stocks: AAPL, MSFT, GOOG, AMZN, META, NVDA, TSLA
- GOOG 332.60 Bullish 1.85% ▲
- MSFT 393.35 Bullish 1.09% ▲
- AAPL 340.08 Bullish 0.94% ▲
- NVDA 197.01 Bullish 0.25% ▲
- META 593.41 Bearish -0.08% ▼
- AMZN 230.86 Bearish -0.23% ▼
- TSLA 307.44 Bearish -0.58% ▼
Mixed: GOOG is the most bullish mover at +1.85%, followed by MSFT at +1.09% and AAPL at +0.94%. NVDA is modestly Bullish at +0.25%. TSLA is the most bearish mover at -0.58%, while AMZN is Bearish at -0.23% and META is marginally Bearish at -0.08%.
Cross-Market ETFs: TLT, GLD, USO, IBIT
- TLT 84.24 Bullish 0.59% ▲
- GLD 369.37 Bearish -1.40% ▼
- IBIT 36.14 Bearish -1.71% ▼
- USO 120.49 Bearish -3.42% ▼
Other ETFs were Mixed: TLT was the most bullish mover at +0.59%, while USO was the most bearish mover at -3.42%. GLD declined -1.40% and IBIT fell -1.71%.
ETF, Mag7, and Cross-Market ETF Insights
Overall Tone
Mixed tone: large-cap value and several Mag7 names are Bullish, while QQQ and cross-market risk assets are Bearish.
Equity ETFs and Mag7:
Major Index ETFs are selective: DIA leads +1.08%, while SPY +0.24%, IWM +0.16%, and IJH +0.04% are modest to marginally Bullish; QQQ is Bearish at -0.97%. Mag7 leadership is led by GOOG, the most bullish equity mover at +1.85%, followed by MSFT +1.09% and AAPL +0.94%, while TSLA is the most bearish mover at -0.58%. META is near-flat Bearish at -0.08%, and AMZN is Bearish at -0.23%, reinforcing selective rather than broad equity alignment.
Cross-Market ETFs:
TLT is Bullish at +0.59%, contrasting with Bearish GLD at -1.40%, IBIT at -1.71%, and USO at -3.42%. TLT is the most bullish cross-market mover, while USO is the most bearish mover, with commodity and digital-asset weakness diverging from the modestly Bullish broad-equity ETFs.
Futures Indices – Higher Time Frame Analysis
Summary of the current state of US Indices Futures based on higher time-frame (HTF) technical analysis as of: 2026-07-29: 07:16 CT.
US Indices Futures
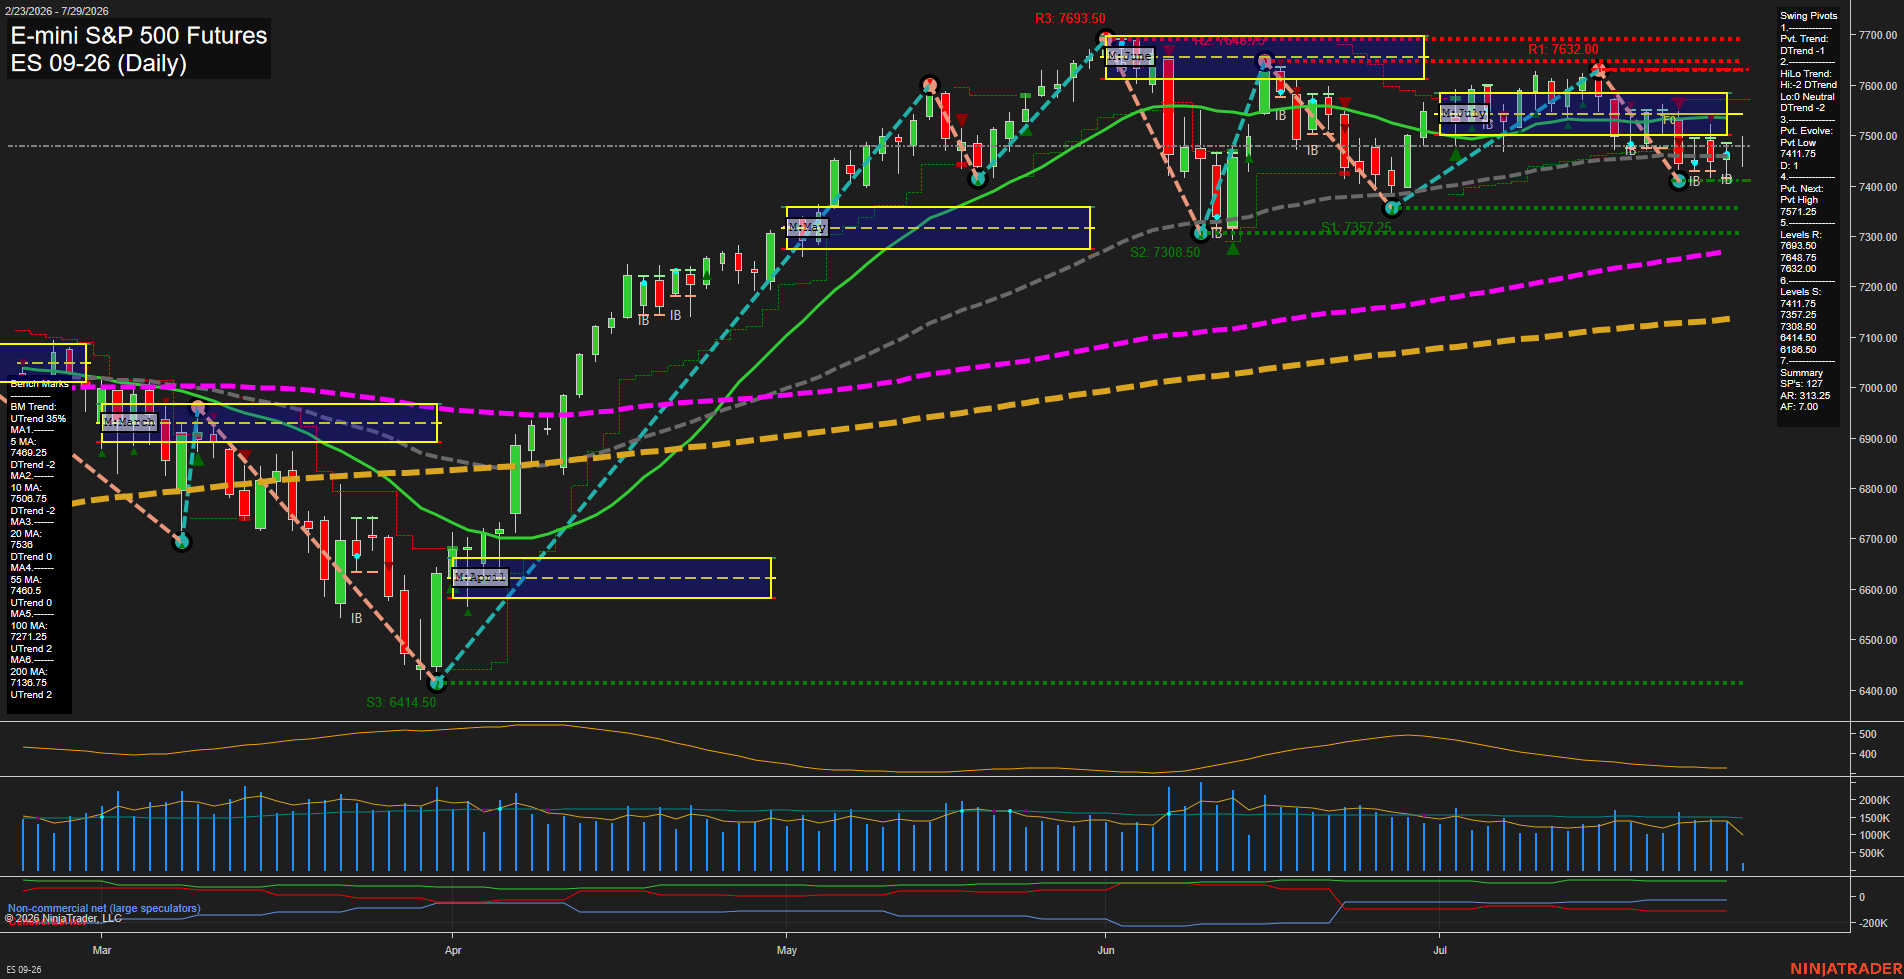
- ES: YSFG above F0%, MSFG/WSFG below F0%, 7300 pivot support, 7693.50 resistance; declining short benchmarks, rising 20–200 period benchmarks.
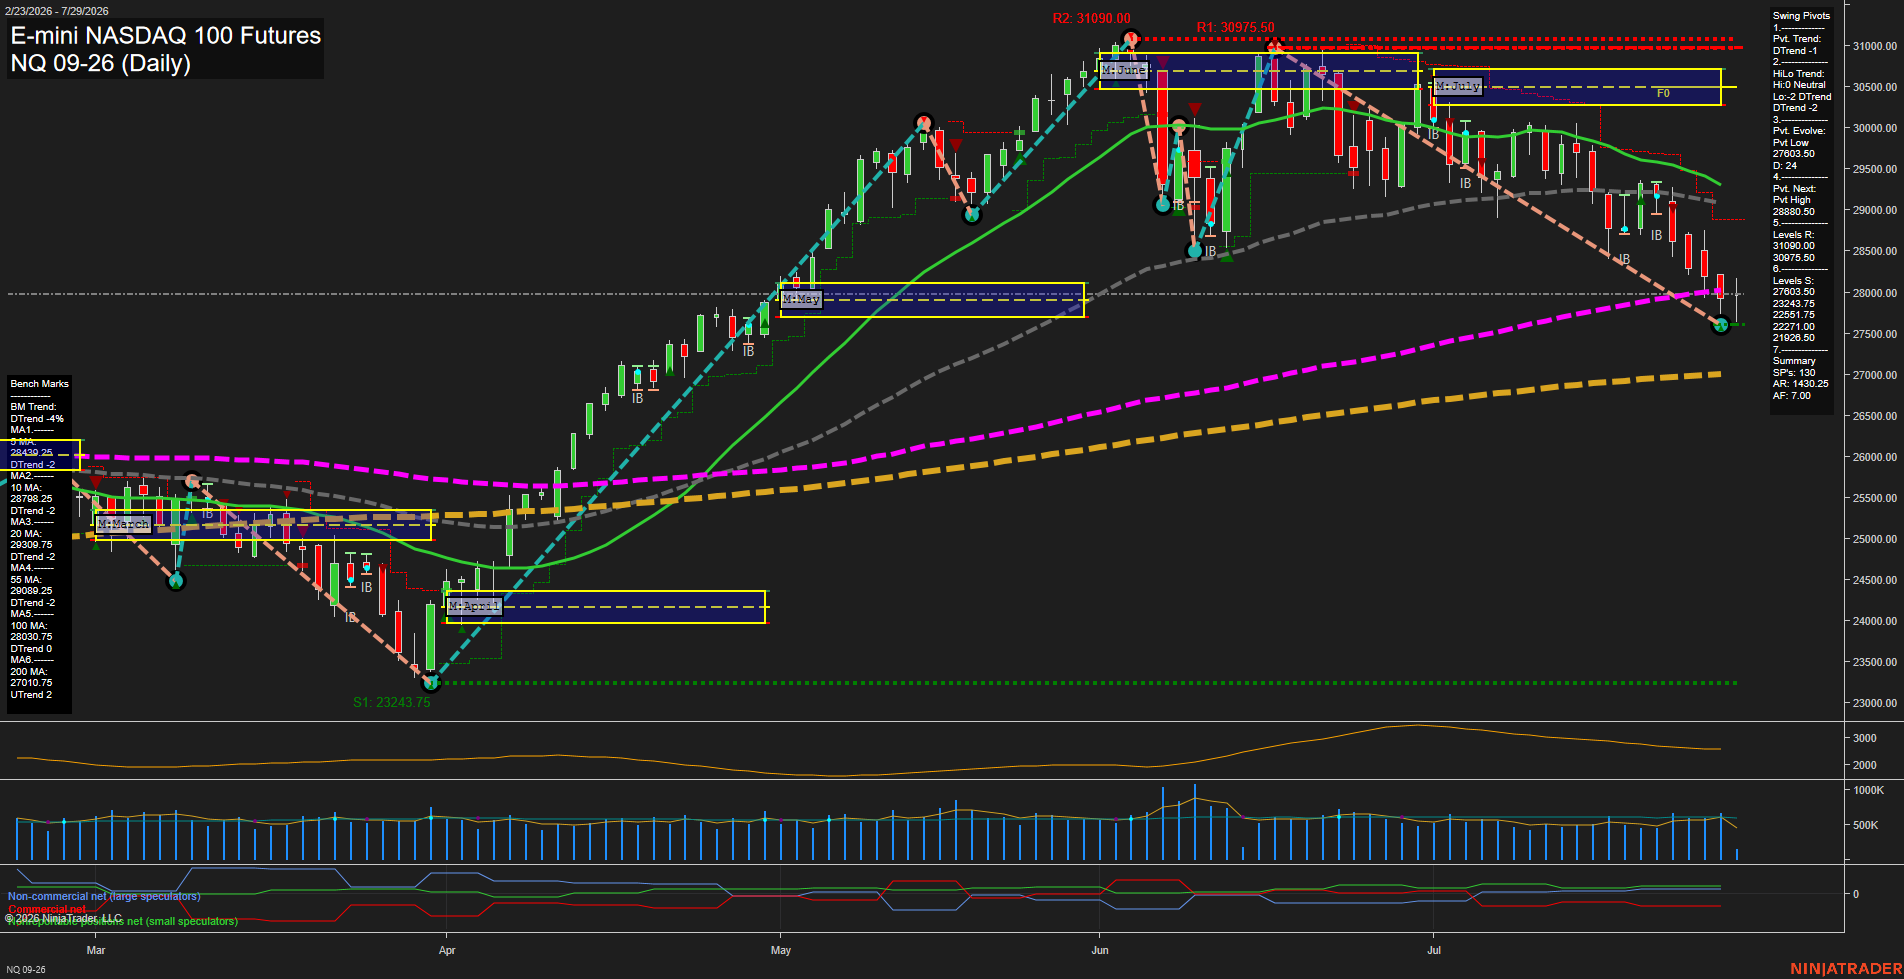
- NQ: YSFG above F0%, MSFG/WSFG weak, 27603.50–27803.50 support, 28880.50 reversal pivot, 31090 resistance; below short-to-100-day benchmarks.
- YM: YSFG/MSFG/WSFG above F0%, UTrend pivots, all benchmarks rising; 51961–51720 support, 53105 and 53656–53658 resistance.
- EMD: YSFG above F0%, MSFG/WSFG below F0%, UTrend pivots; 3724–3692.9 support, 3847.2 and 3892.4 resistance, benchmarks rising.
- RTY: YSFG/WSFG above F0%, MSFG below F0%; 2931.7 support, 3017.9 reversal pivot, 3068.4 resistance; daily short-term pivot downtrend.
- FDAX: YSFG/MSFG/WSFG above F0%, UTrend pivots, all benchmarks rising; 24715 and 25149–25214 support, 25676 and 26064 resistance.
Overall State
- Short-Term: Bearish
- Intermediate-Term: Neutral
- Long-Term: Bullish
Conclusion
ES and NQ remain the weaker directional correlation, with bearish daily structures, MSFG/WSFG weakness, and price below key short-term benchmarks. YM and FDAX retain aligned bullish Fib-grid, pivot, and benchmark structures. EMD and RTY remain mixed, as longer-term UTrend conditions persist alongside consolidation or daily pullbacks. Across the group, YSFG structure remains broadly upward, preserving long-term bullish market structure while near-term resistance and lower pivot references define current ranges.
Note: Intra-day counter-trend pullbacks or retracements may occur, HTF is context for informational usage and market structure. Glossary: Session Fib Grids periods of YSFG:’Yearly’, MSFG:’Monthly’, WSFG:’Weekly’
For full details visit: AlphaWebTrader Technicals
ES Daily View
Overall Rating
- Short-Term: Bearish
- Intermediate-Term: Bearish
- Long-Term: Bullish.
Key Insights Summary
Price is consolidating near 7475 after a rejection from the July highs, with small daily bars and slow momentum reflecting a compressed, choppy pullback rather than an impulsive recovery. Short-term and monthly fib-grid conditions remain below their F0% reference areas, while the pivot structure is in DTrend and recent signals are aligned to the downside. The 7519.25 pivot threshold and the declining 10- and 20-day averages define the nearby overhead pressure zone. Support is concentrated at 7411.75 and 7375.25, followed by 7308.50. The larger 100- and 200-day benchmarks remain rising and price remains above the yearly grid, preserving the broader long-term uptrend despite the current short- and intermediate-term corrective phase.
View charts on: AlphaWebTrader HTF Charts
NQ Daily View
Overall Rating
- Short-Term: Bearish
- Intermediate-Term: Bearish
- Long-Term: Bullish.
Key Insights Summary
The daily structure reflects a fast, medium-range selloff from the June high, with lower highs and lower lows maintaining the short-term pivot downtrend. Price is below the weekly and July monthly Fib-grid centers and beneath all major averages through the 100-day benchmark, confirming broad short-to-intermediate-term weakness. The 27603.50 pivot low is the immediate structural support, while 28880.50 defines the next opposite-pivot reversal level. Longer-term structure remains constructive because price is above the rising 200-day average and the 2026 yearly Fib-grid trend remains up, framing the current decline as a significant countertrend retracement within the larger advance.
View charts on: AlphaWebTrader HTF Charts
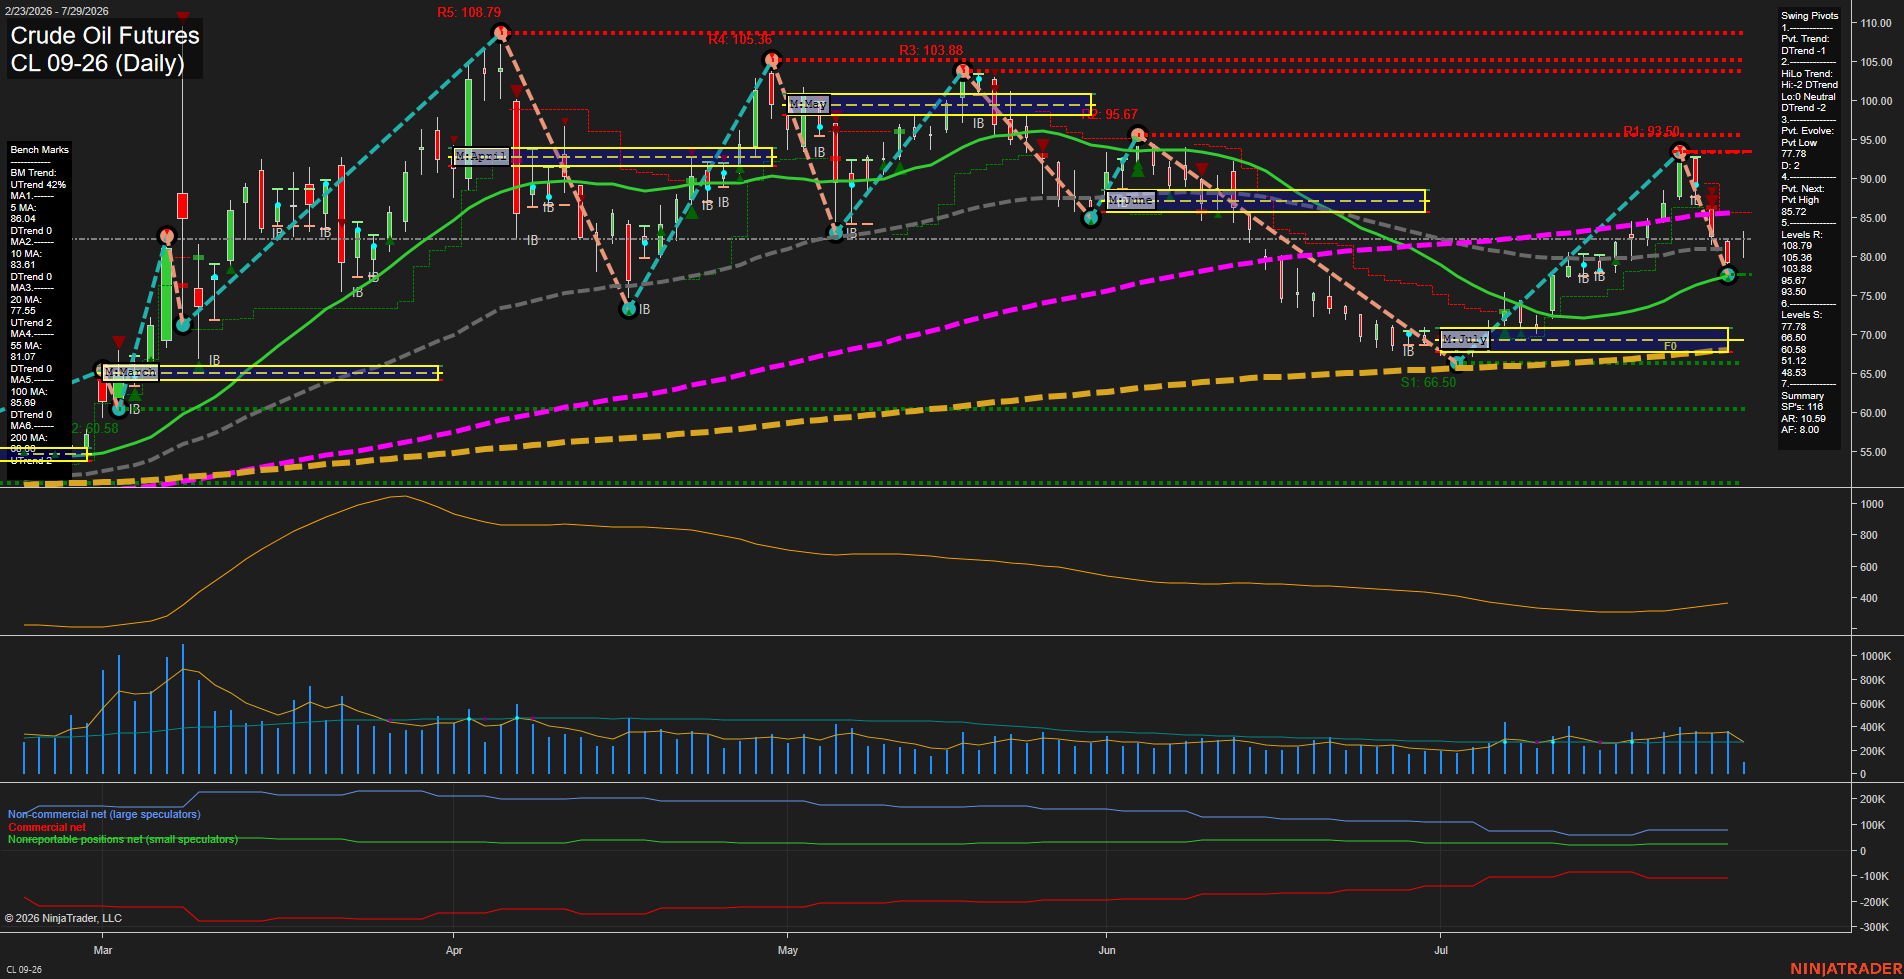
CL Daily View
Overall Rating
- Short-Term: Bearish
- Intermediate-Term: Neutral
- Long-Term: Neutral.
Key Insights Summary
CL has shifted into a sharp short-term selloff, with price below the weekly F0% level, below the 5- and 10-day benchmarks, and a DTrend pivot structure. The decline has retraced the July recovery and is testing the active 77.78 pivot-low support area while momentum remains fast. Intermediate conditions are mixed: the monthly grid and 20-day average remain constructive, but price is below the declining 55-day average and the HiLo pivot trend remains down. Longer-term structure remains supported by price above the yearly grid and rising 200-day average, although the falling 100-day average reflects persistent overhead supply. The 85.72 pivot-next level and clustered 81.07 to 86.40 moving averages define the nearest rebound/rejection zone, while 77.78 is the immediate technical inflection level.
View charts on: AlphaWebTrader HTF Charts
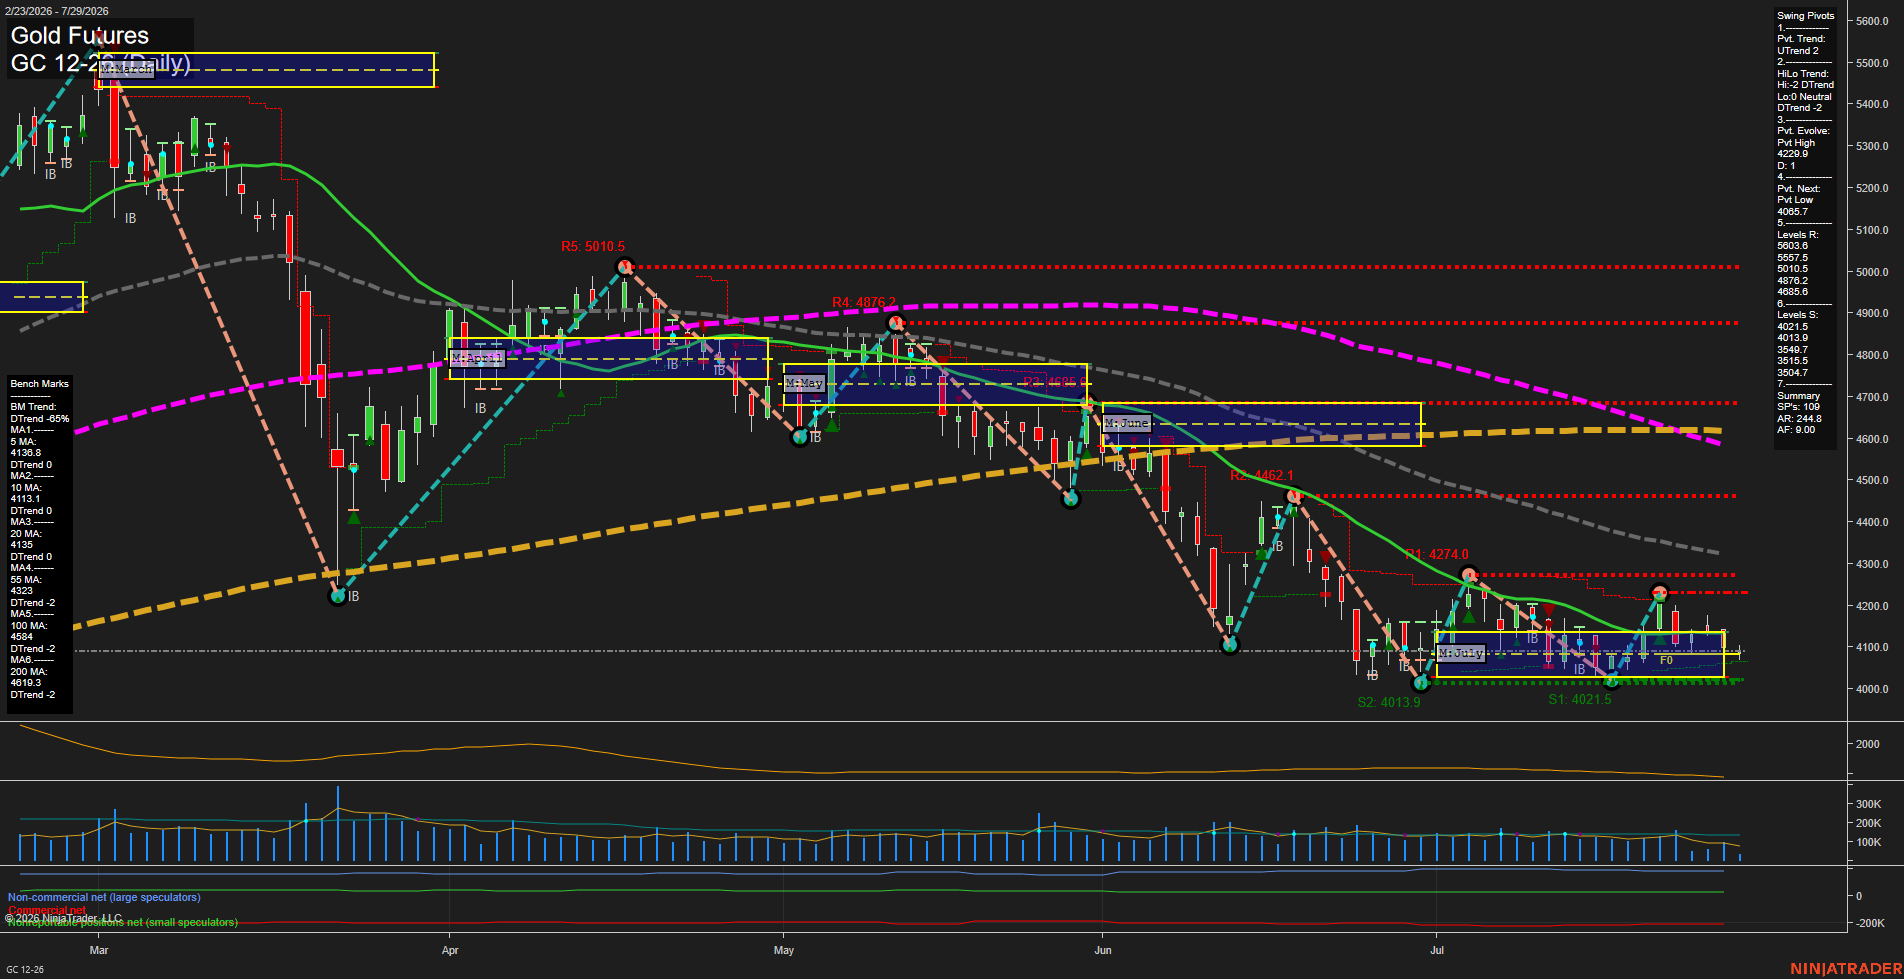
GC Daily View
Overall Rating
- Short-Term: Bearish
- Intermediate-Term: Bearish
- Long-Term: Bearish.
Key Insights Summary
Gold is consolidating in a narrow, low-momentum range near 4106 after a sustained decline. The short-term pivot has turned upward, but price remains below the weekly F0% area and below all daily benchmarks, leaving the bounce structurally counter-trend. The 4021.5-4013.9 support band is the immediate downside reference, while 4113-4153 marks the nearby moving-average resistance zone; 4229.8 is the current pivot-high reversal level. Monthly positioning remains marginally above its F0% level, although the intermediate HiLo trend, long-term yearly grid, and 100/200-day benchmarks retain a broader bearish alignment.
View charts on: AlphaWebTrader HTF Charts