NYSE close roundup: persistent inflation, elevated yields and Middle East energy risks shaped markets as gold rose and software stocks lagged.
Fundamentals: Markets navigated persistent inflation, elevated Treasury yields and Middle East energy-security concerns as the Federal Reserve held rates steady. Softer monthly PCE data and a weaker dollar supported gold above $4,100, while diesel shortages sustained inflation worries. Equities showed selective resilience, with defensive growth and company-specific strength offset by broad software weakness.
Technicals: Microsoft, Amazon and Tesla led listed movers, while Meta, Apple and crude oil ETF USO declined. ES, NQ, YM, EMD and RTY futures remain under short-term selling pressure, with daily structures showing lower highs and tests of nearby support. Longer-term benchmark trends remain broadly constructive, while FDAX maintains bullish alignment near resistance.
After Market Close daily snapshot: market news summary and sentiment, major ETFs, Magnificent 7 analysis, Indices Futures Higher Time Frame Analysis, and E-mini S&P500, Nasdaq 100, NYMEX Crude, Gold Futures Daily Chart analysis.
As of: July 30, 2026 05:00 CT
Market News Summary:
Index-futures cross-currents centered on persistent inflation, elevated bond yields, Middle East energy-security risks, and selective equity-sector resilience.
Primary Drivers & Risks:
- Primary Driver: Hawkish Fed amid persistent inflation
- Primary Risk: Energy disruption lifts inflation pressures
Tone:
Cautious and mixed, with inflation and rates dominating risk sentiment.
Stock Market / ETFs / Indices:
Growth-equity positioning remained selective: SPYG was characterized as more defensive than QQQ because of lower AI-infrastructure and semiconductor concentration and greater hyperscaler and financial exposure. Software stocks weakened broadly, while Microsoft, ServiceNow, Salesforce, and Samsara were identified as relative standouts. O’Reilly reported 7.9% sales growth, 6% comparable-sales growth, strong margins, and substantial share repurchases.
Geopolitical:
A drone strike damaged two gas tankers in Egyptian waters, renewing security concerns around the Suez Canal and a related pipeline used for Saudi oil exports during the Iran war. Middle East conflict also remained a key factor in energy-market attention.
Oil / Energy:
Diesel prices remained under pressure from a global shortage linked to attacks on Russian refineries and lower Chinese refinery runs, adding to inflation concerns. Oil prices moved lower on profit-taking as traders awaited Middle East developments, while WTI held support near $78.56 amid technically stronger momentum. Portugal approved a 33% windfall tax on extraordinary 2026 profits for oil and refining companies.
Gold / Metals:
Gold rebounded above $4,100 as softer June PCE data and a weaker dollar offset the prior day’s hawkish Fed hold; silver also rose. Gold demand remained resilient after the second-quarter selloff, supported by returning central-bank purchases and strong Asian buying. Binance launched USDT-settled, European-style gold and silver options.
Fed / Financials:
The Federal Reserve held rates steady despite persistent inflation and strong activity, with internal division reported within the FOMC. Bond yields remained elevated amid concern over inflation containment, while 30-year Treasury yields broke above key resistance in commentary focused on Fed credibility and fiscal deficits. Mortgage rates rose to 6.66%, their highest level in one year.
Macro / Other:
Core PCE rose 3.3% year over year in June and 0.1% month over month, with the monthly increase below estimates. Headline PCE rose 3.7% year over year and fell 0.1% from the prior month, both in line with forecasts.
Conclusion:
Persistent inflation, the Fed’s rate hold, and elevated long-term yields remain the central macro inputs for index futures. Softer monthly PCE and dollar weakness supported precious metals.
Middle East transport-security concerns and diesel shortages sustain an energy-driven inflation risk. Equity news was mixed, with selective strength in defensive growth positioning and company-specific fundamentals against broader software weakness.
Market News Sentiment
Market News Articles: 46
- Neutral: 63.04%
- Negative: 21.74%
- Positive: 15.22%
Sentiment Summary: Market news sentiment is predominantly neutral at 63%, with negative articles at 22% and positive articles at 15%.
Conclusion: The news flow presents a largely neutral tone for indices futures day traders, with negative coverage exceeding positive coverage.
GLD,Gold Articles: 13
- Neutral: 38.46%
- Positive: 38.46%
- Negative: 23.08%
Sentiment Summary: GLD and gold coverage is balanced, with 38% positive, 38% neutral, and 23% negative sentiment across 13 articles.
Conclusion: Gold-related news tone is mixed to neutral-positive, with positive and neutral coverage equally represented.
USO,Oil Articles: 12
- Negative: 41.67%
- Positive: 41.67%
- Neutral: 16.67%
Sentiment Summary: USO and oil coverage is evenly split, with 42% positive, 42% negative, and 17% neutral articles.
Conclusion: Oil-related news sentiment is balanced, providing no clear directional bias for indices futures day traders.
Market Data Snapshot
ETF Snapshot of major stock market ETFs, Mag7, and others as of: July 30, 2026 05:00
Top Movers & Losers
- MSFT 451.10 Bullish 15.51% ▲
- AMZN 235.50 Bullish 3.90% ▲
- TSLA 308.85 Bullish 3.53% ▲
- AAPL 333.43 Bearish -1.41% ▼
- USO 127.48 Bearish -1.42% ▼
- META 539.03 Bearish -7.95% ▼
Major Index ETFs: SPY, QQQ, DIA, IWM, IJH
- QQQ 683.55 Bullish 3.30% ▲
- SPY 741.69 Bullish 1.68% ▲
- IWM 292.59 Bullish 1.39% ▲
- DIA 521.51 Bullish 1.18% ▲
- IJH 75.35 Bullish 0.83% ▲
Major index ETFs were uniformly Bullish, led by QQQ at +3.30%. SPY gained +1.68%, followed by IWM at +1.39% and DIA at +1.18%. IJH was the least positive mover, up +0.83%, while breadth remained Bullish across the group.
Mag 7 Stocks: AAPL, MSFT, GOOG, AMZN, META, NVDA, TSLA
- MSFT 451.10 Bullish 15.51% ▲
- AMZN 235.50 Bullish 3.90% ▲
- TSLA 308.85 Bullish 3.53% ▲
- NVDA 195.04 Bullish 2.65% ▲
- GOOG 333.68 Bearish -0.62% ▼
- AAPL 333.43 Bearish -1.41% ▼
- META 539.03 Bearish -7.95% ▼
Mag7 performance was Mixed: MSFT led bullish momentum at +15.51%, while AMZN +3.90%, TSLA +3.53%, and NVDA +2.65% were also bullish. META was the most bearish mover at -7.95%, with AAPL at -1.41% and GOOG at -0.62% bearish.
Cross-Market ETFs: TLT, GLD, USO, IBIT
- IBIT 36.70 Bullish 1.94% ▲
- GLD 377.16 Bullish 1.64% ▲
- TLT 82.80 Bearish -0.06% ▼
- USO 127.48 Bearish -1.42% ▼
Other ETFs were Mixed: IBIT was the most bullish mover at +1.94%, followed by GLD at +1.64%. USO was the most bearish mover at -1.42%, while TLT was marginally Bearish at -0.06%.
ETF, Mag7, and Cross-Market ETF Insights
Overall Tone
Mixed: Major Index ETFs were Bullish, while Mag7 and Cross-Market ETFs showed selective leadership alongside notable Bearish divergence.
Equity ETFs and Mag7:
Major Index ETFs were broadly Bullish, led by QQQ at +3.30%, followed by SPY at +1.68%, IWM at +1.39%, DIA at +1.18%, and IJH at +0.83%. Mag7 was Mixed: MSFT was the most bullish mover at +15.51%, with AMZN at +3.90%, TSLA at +3.53%, and NVDA at +2.65%, while GOOG fell -0.62% and AAPL declined -1.41%. META was the most bearish mover across equities at -7.95%, creating selective rather than fully aligned equity strength.
Cross-Market ETFs:
Cross-Market ETFs were Mixed, with IBIT leading at +1.94% and GLD advancing +1.64%, alongside Bullish equity ETF performance. USO was the most bearish cross-market mover at -1.42%, while TLT was marginally Bearish at -0.06%. The strength in IBIT and GLD contrasted with Bearish oil and near-flat Treasury pricing.
Futures Indices – Higher Time Frame Analysis
Summary of the current state of US Indices Futures based on higher time-frame (HTF) technical analysis as of: 2026-07-30: 17:00 CT.
US Indices Futures
- ES: YSFG above, MSFG/WSFG below F0%; declining short benchmarks, DTrend; 7693.50 resistance, 7492.00 reversal pivot, 7324.00-7308.50 support.
- NQ: YSFG above, MSFG/WSFG below F0%; short DTrend below benchmarks; 27201.50 support, 28498.00 reversal pivot, 29938.00 resistance.
- YM: YSFG above, MSFG/WSFG below centers; DTrend daily, rising long benchmarks; 51630 support, 52818 reversal pivot, 53105-53666 resistance.
- EMD: YSFG above, MSFG/WSFG below F0%; declining short benchmarks, down pivot; 3730.5-3724.0 support, 3832.9-3892.4 resistance.
- RTY: YSFG above, MSFG/WSFG below centers; short correction under 5/10 benchmarks; 2901.9 support, 2843.8 pivot, 3068.4 resistance.
- FDAX: YSFG, MSFG, WSFG above centers; rising benchmarks and UTrend; 25678/26064 resistance, 24960 reversal pivot, 24715 support.
Overall State
- Short-Term: Bearish
- Intermediate-Term: Bearish
- Long-Term: Bullish
Conclusion
ES, NQ, YM, EMD, and RTY share short-term MSFG/WSFG weakness, declining short benchmarks, and corrective pivot structures while remaining above yearly frameworks and long-term benchmarks. FDAX retains aligned bullish grids and benchmarks, leading the broader index group. US index resistance is defined by recent swing highs, with listed pivot lows and support bands framing the active retracements.
Note: Intra-day counter-trend pullbacks or retracements may occur, HTF is context for informational usage and market structure. Glossary: Session Fib Grids periods of YSFG:’Yearly’, MSFG:’Monthly’, WSFG:’Weekly’
For full details visit: AlphaWebTrader Technicals
ES Daily View
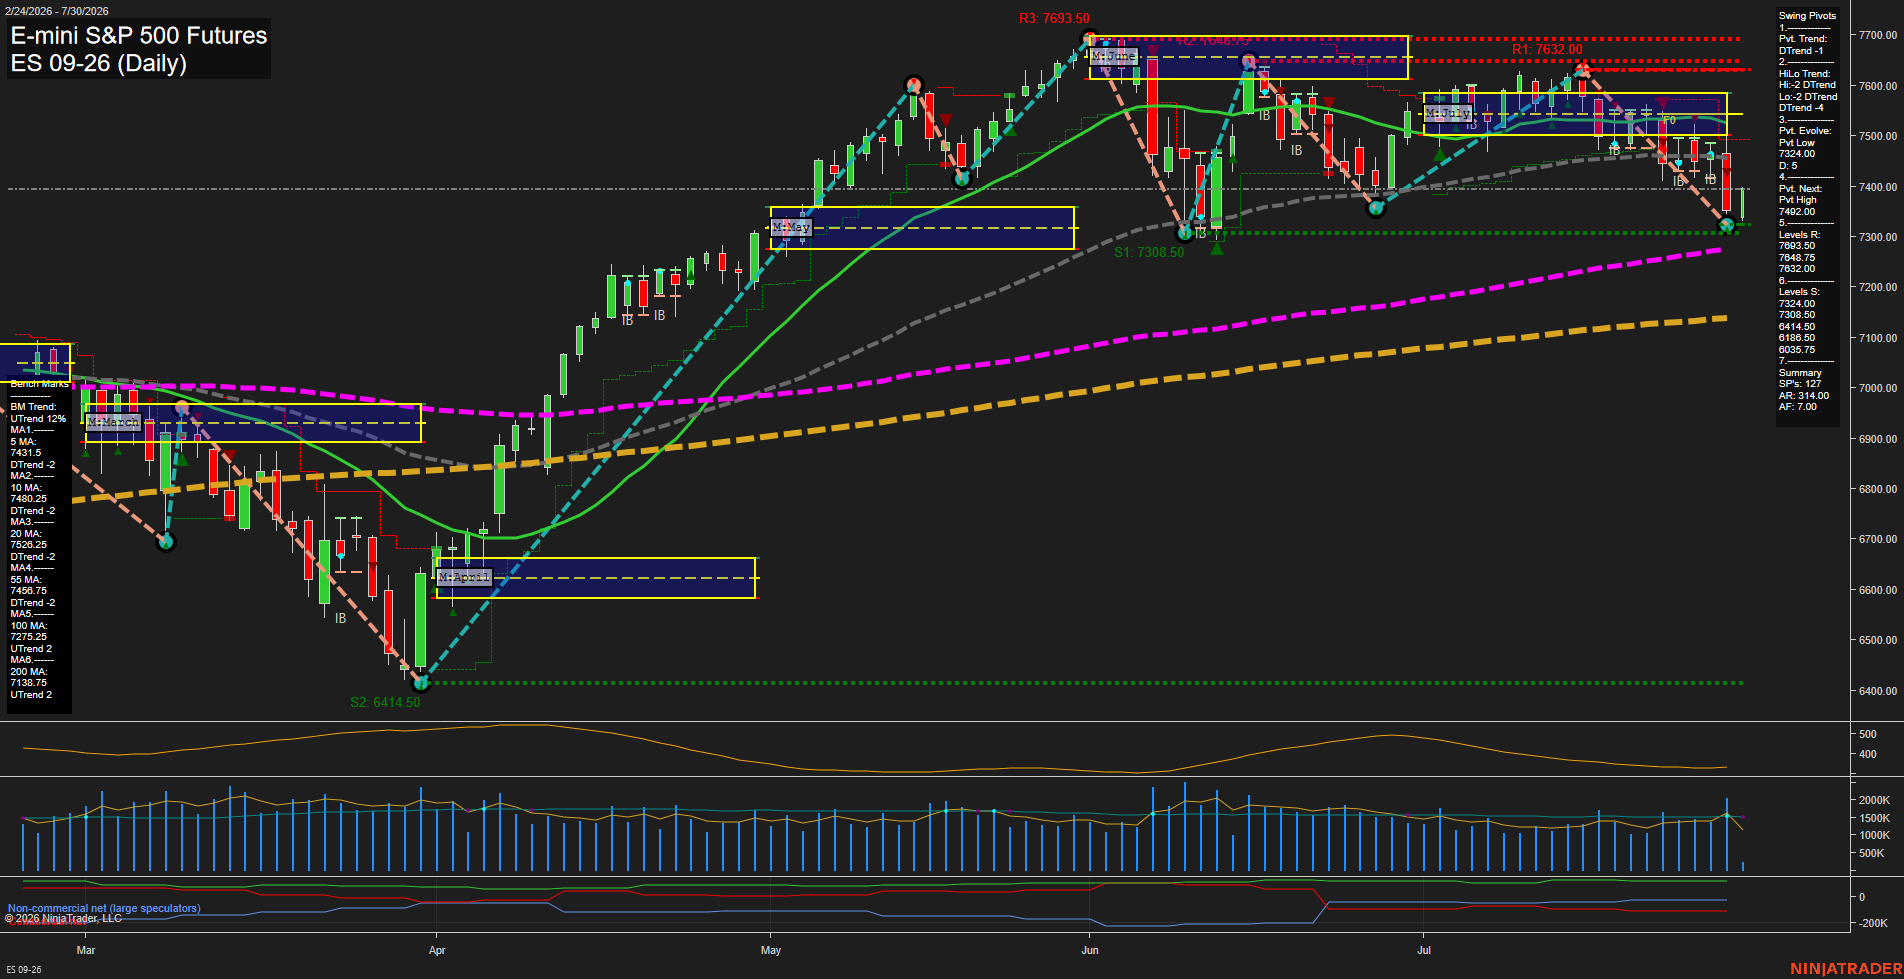
Overall Rating
- Short-Term: Bearish
- Intermediate-Term: Bearish
- Long-Term: Bullish.
Key Insights Summary
Daily structure reflects a fast short-term selloff, with price below the weekly and monthly Fib-grid centers and beneath all short- and intermediate-term benchmarks. Both pivot trends are down, confirming lower-high/lower-low behavior; 7492.00 defines the next pivot reversal threshold, while the 7324.00 to 7308.50 support band is the immediate downside test area. The broader 2026 structure remains constructive because price is above rising 100-day and 200-day benchmarks, framing the current decline as an intermediate-term retracement within a longer-term advance.
View charts on: AlphaWebTrader HTF Charts
NQ Daily View
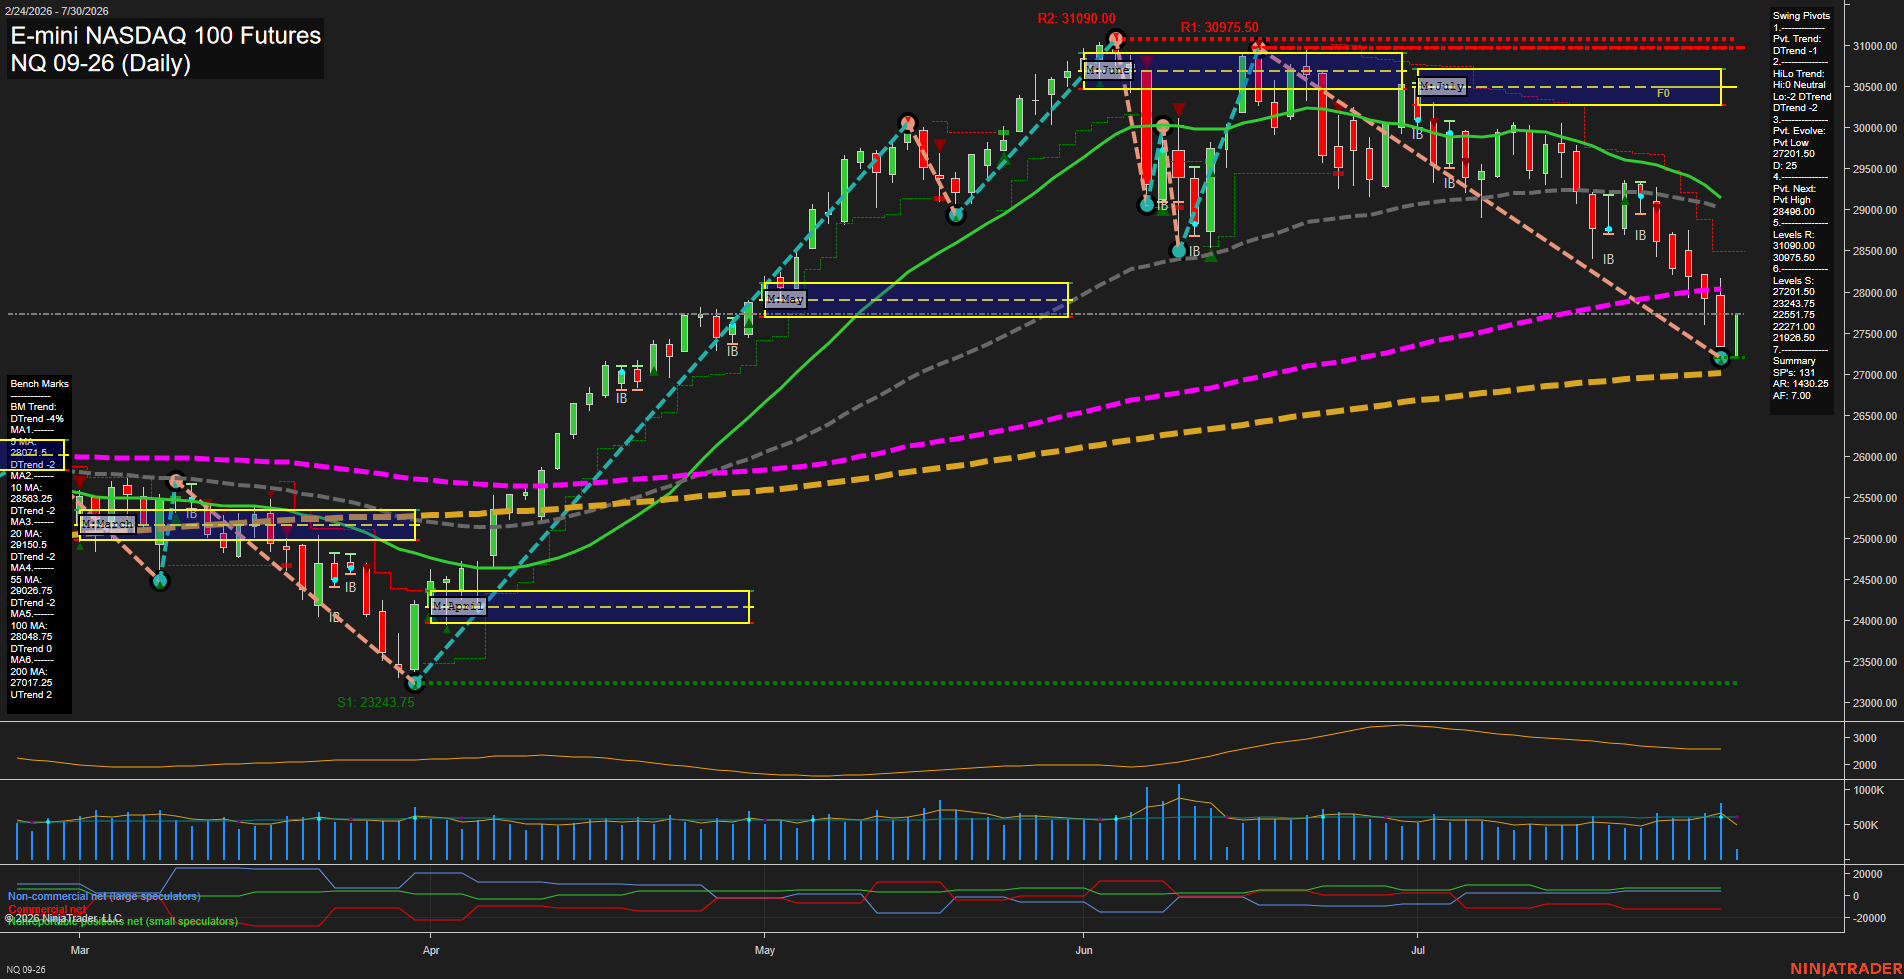
Overall Rating
- Short-Term: Bearish
- Intermediate-Term: Bearish
- Long-Term: Bullish.
Key Insights Summary
Price is in a fast, high-volatility downswing beneath the weekly and July monthly F0%/NTZ structures and below all short- through intermediate-term benchmarks. The late-July decline has produced lower highs and lower lows, while the 27201.50 pivot-low area is being tested near the rising 200-day average at 27017.25. The developing bounce is counter-trend within the short-term DTrend; 28498.00 is the next pivot-reversal reference. The annual grid remains positive and the 200-day benchmark is rising, preserving a longer-term bullish structural backdrop despite the current intermediate-term retracement.
View charts on: AlphaWebTrader HTF Charts
CL Daily View
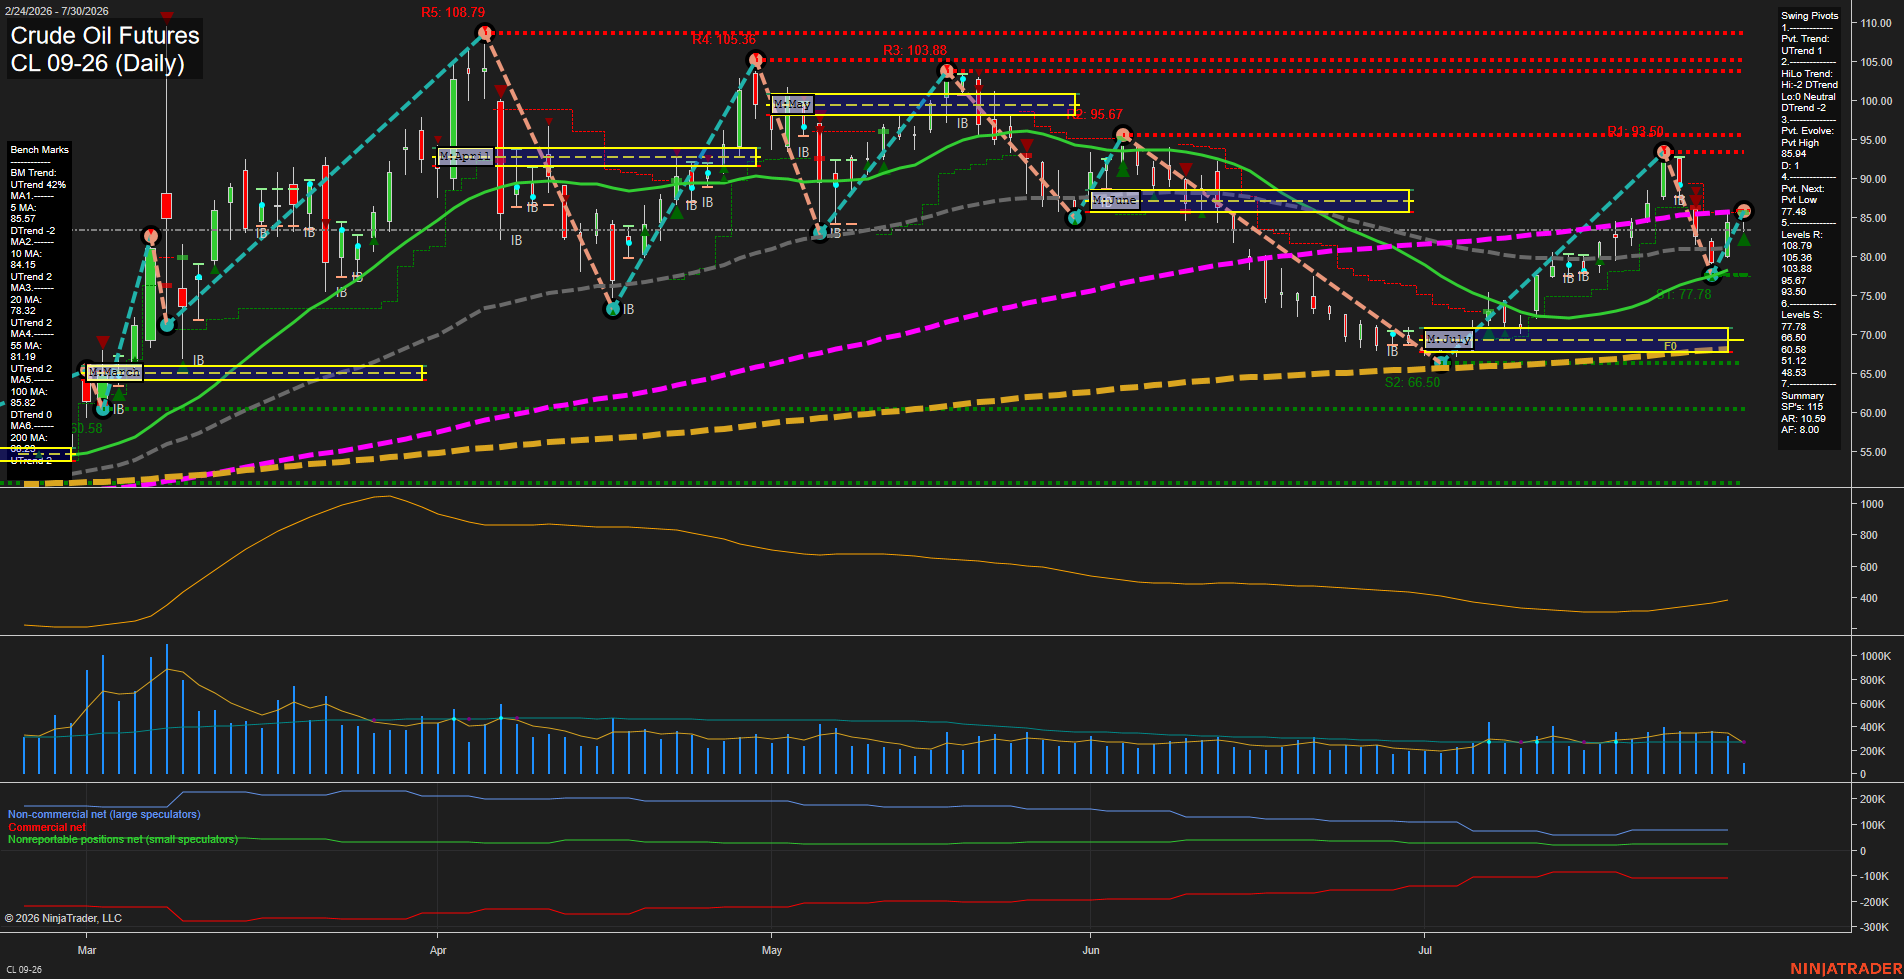
Overall Rating
- Short-Term: Neutral
- Intermediate-Term: Bullish
- Long-Term: Bullish.
Key Insights Summary
Price is consolidating near 85.48 after a sharp July recovery from the 66.50 area. The short-term pivot structure has turned higher, but the weekly Fib grid remains down and the 5-day average is marginally declining, creating a mixed near-term condition. Intermediate structure remains constructive above rising 20- and 55-day benchmarks, while the longer-term yearly grid and rising 200-day average retain an upward bias. The 85.82 to 93.50 zone marks nearby overhead resistance, while 77.78 is the key swing support beneath the current recovery structure.
View charts on: AlphaWebTrader HTF Charts
GC Daily View
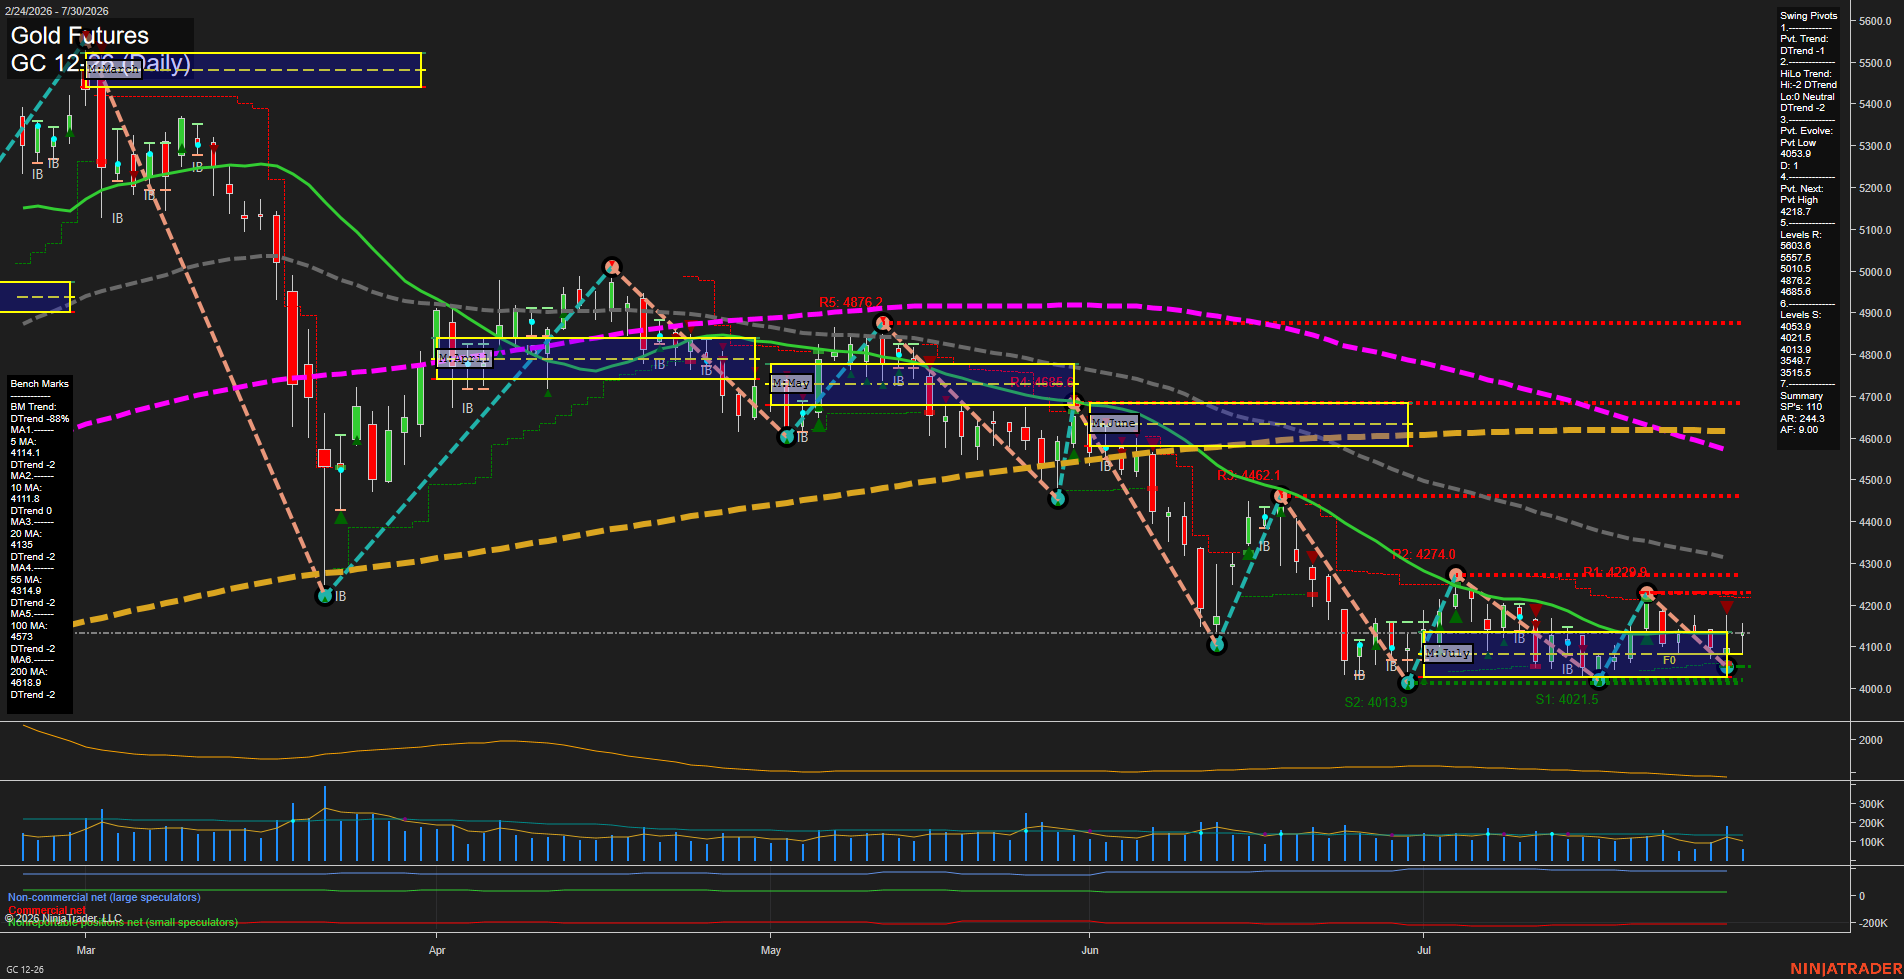
Overall Rating
- Short-Term: Bearish
- Intermediate-Term: Bearish
- Long-Term: Bearish.
Key Insights Summary
Gold is consolidating in a narrow July range near 4112 following a broader decline from the June and May highs. The short-term pivot structure remains in DTrend, with price holding only marginally above the 10-day benchmark while remaining below the declining 5-, 20-, 55-, 100-, and 200-day averages. The 4053.9 pivot low and clustered 4021.5-4013.9 supports define the lower edge of the current compression, while 4218.7 is the next pivot-reversal threshold. July MSFG remains positive above its F0% area, representing a counter-trend monthly bounce inside a bearish intermediate and long-term structure. Small daily bars and subdued volume indicate slow momentum and choppy consolidation rather than a decisive trend expansion.
View charts on: AlphaWebTrader HTF Charts