NYSE pre-market radar tracks index futures, ETF movers, Apple and Amazon earnings, GDP and PCE data, Treasury yields, oil risks and AI valuations.
Fundamentals: U.S. equity sentiment remains cautious after the Federal Reserve held rates steady, with higher long-term Treasury yields and AI valuation scrutiny weighing on risk assets. Apple and Amazon report after the close, while Advance GDP, Core PCE, GDP prices and unemployment claims headline the economic calendar. Middle East supply disruptions continue to support energy-market attention.
Technicals: U.S. index futures enter the NYSE pre-market session under short-term bearish pressure after broad late-July pullbacks. ES, NQ, YM, EMD and RTY show corrective or mixed near-term structures while retaining largely bullish longer-term benchmarks. ETF leaders included USO, GOOG and GLD, while DIA, TSLA and NVDA declined. FDAX remains a multi-timeframe bullish outlier near resistance.
Pre-Market Trading 360° view Market Radar of: holidays, earnings, eco-news, market-news summary, news sentiment, prior session major ETFs, MAG7, Higher Time Frame Analysis Indices Futures Summary, and E-mini S&P500, Nasdaq 100, NYMEX Crude, Gold Futures Daily Chart analysis.
As of: July 30, 2026 07:16 CT
Earnings Radar
Monitoring for earnings releases by the Magnificent 7, AI-tech-related firms, and major financial institutions.
- AAPL Release: 2026-07-30 T:AMC
- AMZN Release: 2026-07-30 T:AMC
Conclusion: AAPL and AMZN report after the close on 2026-07-30, concentrating broad index-relevant earnings risk in the post-market session and subsequent futures reaction. Market momentum and volume can slow ahead of these major tech releases.
For full details visit: Yahoo Earnings Calendar
EcoNews Radar U.S. Events
| Day | Time | Impact | Event |
|---|---|---|---|
| Thu | 08:30 | High | Advance GDP q/q |
| Thu | 08:30 | High | Core PCE Price Index m/m |
| Thu | 08:30 | Medium | Advance GDP Price Index q/q |
| Thu | 08:30 | Medium | Unemployment Claims |
| Fri | 08:30 | Medium | Employment Cost Index q/q |
| Fri | 10:00 | Medium | Revised UoM Consumer Sentiment |
| Fri | 10:00 | Medium | Revised UoM Inflation Expectations |
EcoNews Summary
Thursday’s 08:30 USD releases contain the week’s qualifying high-impact EcoNews events: Advance GDP q/q and Core PCE Price Index m/m. The combined growth and inflation data set provides a concentrated catalyst for U.S. index futures and broader rate-sensitive market pricing.
Event Notes:
- Thursday 08:30 – Advance GDP q/q: The first estimate of annualized quarterly U.S. economic growth. Traders monitor it for evidence of changes in economic activity, demand conditions, and the growth backdrop for equities and interest-rate markets.
- Thursday 08:30 – Core PCE Price Index m/m: A monthly measure of underlying consumer-price inflation excluding food and energy. Traders monitor it as a key inflation gauge and for its influence on interest-rate expectations and index-futures volatility.
Conclusion:
The single most important event is Thursday’s 08:30 Core PCE Price Index m/m release, alongside Advance GDP q/q. Market momentum and volume often slow ahead of major PCE and GDP releases, with increased volatility at release time.
For full details visit: Forex Factory EcoNews
Market News Summary:
Equity sentiment weakened after the Fed held rates steady, while rising long-term yields, AI valuation concerns, and the U.S.-Iran war remained central market forces.
Primary Drivers & Risks:
- Primary Driver: Fed credibility and Treasury yields
- Primary Risk: Middle East energy disruption
Tone:
Risk-off and volatile, with inflation and geopolitical pressures outweighing selective earnings resilience.
Stock Market / ETFs / Indices:
All three major U.S. stock indexes fell after Fed Chair Kevin Warsh’s press conference. The Dow had retreated more than 3.25% from its high, while the Fear and Greed Index moved into the Fear zone. AI-linked valuation concerns intensified, with commentary citing aggressive S&P 500 earnings assumptions, distorted AI-leader profits, semiconductor concentration, and weakness in a major Chinese AI supplier’s Hong Kong debut. Dividend Aristocrats and the NOBL ETF remained relative outperformers versus SPY year to date.
Geopolitical:
The U.S.-Iran war tightened Middle East crude supply conditions and widened concerns around energy infrastructure security. A drone strike caused fires on a regasification ship and storage vessel at an Egyptian Mediterranean port, while tankers continued moving through conflict zones.
Oil / Energy:
Middle East supply risks supported the broader oil backdrop, sending Canadian crude to Japan for the first time in over a year and lifting the USO oil ETF sharply since the war began. Oil prices also pulled back after strong gains as tanker traffic continued; WTI and Brent technical commentary emphasized supply disruptions and recovery momentum.
Gold / Metals:
Gold rose after the Fed held rates steady, but later traded near critical support as major central banks retained a tightening bias. Platinum faced pressure from Fed uncertainty and dollar strength despite tighter South African supply.
Fed / Financials:
The Fed held rates unchanged in a 9-3 vote, but the decision and Warsh’s press conference triggered market turbulence. Long-term Treasury yields rose to two-decade highs as investors questioned inflation containment and the Fed’s credibility, even as pricing for a near-term hike eased. Debate remains focused on whether inflation metrics overstate underlying price pressure and whether a September rate increase is needed.
Macro / Other:
Foreign-exchange markets focused on Bank of Japan guidance. South Korean exports remained supported by AI-chip demand, though the pace of export growth moderated from an exceptionally strong level. U.S. policy discussion around tighter AI controls added another regulatory consideration for the technology sector.
Conclusion:
Fed communication, higher long-term yields, and the U.S.-Iran conflict are the dominant inputs for index futures. Equity pressure followed the Fed event, while energy supply concerns sustained elevated oil-market attention.
AI earnings and valuation scrutiny remains a technology-sector headwind despite continued chip-demand strength. Oil’s pullback, mixed precious-metals action, and central-bank policy signals create cross-currents across inflation-sensitive markets.
Market News Sentiment
Market News Articles: 46
- Neutral: 56.52%
- Negative: 30.43%
- Positive: 13.04%
Sentiment Summary: Of 46 market news articles, 57% were neutral, 30% negative, and 13% positive.
Conclusion: News tone for indices futures is predominantly neutral, with negative coverage exceeding positive coverage.
GLD,Gold Articles: 8
- Positive: 50.00%
- Negative: 37.50%
- Neutral: 12.50%
Sentiment Summary: Gold-related coverage is mixed-to-positive, with 50% positive, 38% negative, and 13% neutral articles.
Conclusion: For indices futures day traders, gold sentiment reflects a divided risk-tone signal with a modest positive bias.
USO,Oil Articles: 11
- Positive: 63.64%
- Negative: 27.27%
- Neutral: 9.09%
Sentiment Summary: USO/Oil coverage is predominantly positive at 64%, with 27% negative and 9% neutral across 11 articles.
Conclusion: Oil-related news tone is net positive, representing a supportive sentiment input for indices futures day traders.
Market Data Snapshot
ETF Snapshot of major stock market ETFs, Mag7, and others as of: July 30, 2026 07:16
Top Movers & Losers
- USO 129.31 Bullish 7.32% ▲
- GOOG 335.76 Bullish 0.95% ▲
- GLD 371.08 Bullish 0.46% ▲
- DIA 515.41 Bearish -2.18% ▼
- TSLA 298.32 Bearish -2.97% ▼
- NVDA 190.01 Bearish -3.55% ▼
Major Index ETFs: SPY, QQQ, DIA, IWM, IJH
- SPY 729.46 Bearish -1.54% ▼
- IWM 288.57 Bearish -1.64% ▼
- IJH 74.73 Bearish -1.71% ▼
- QQQ 661.73 Bearish -2.04% ▼
- DIA 515.41 Bearish -2.18% ▼
Major index ETFs are uniformly Bearish: DIA is the most bearish mover at -2.18%, followed by QQQ at -2.04%. IJH declined -1.71%, IWM fell -1.64%, and SPY was the least negative mover at -1.54%.
Mag 7 Stocks: AAPL, MSFT, GOOG, AMZN, META, NVDA, TSLA
- GOOG 335.76 Bullish 0.95% ▲
- AAPL 338.19 Bearish -0.56% ▼
- MSFT 390.54 Bearish -0.71% ▼
- META 585.61 Bearish -1.31% ▼
- AMZN 226.65 Bearish -1.82% ▼
- TSLA 298.32 Bearish -2.97% ▼
- NVDA 190.01 Bearish -3.55% ▼
Mag7 is Bearish overall: GOOG is the most bullish mover at +0.95%, while NVDA is the most bearish mover at -3.55%. TSLA -2.97%, AMZN -1.82%, META -1.31%, MSFT -0.71%, and AAPL -0.56% are Bearish.
Cross-Market ETFs: TLT, GLD, USO, IBIT
- USO 129.31 Bullish 7.32% ▲
- GLD 371.08 Bullish 0.46% ▲
- IBIT 36.00 Bearish -0.39% ▼
- TLT 82.85 Bearish -1.65% ▼
Mixed cross-market snapshot: USO is the most bullish mover at +7.32%, while GLD is modestly Bullish at +0.46%. TLT is the most bearish mover at -1.65%, and IBIT is marginally Bearish at -0.39%.
ETF, Mag7, and Cross-Market ETF Insights
Overall Tone
Bearish risk-off tone in equities, with Mixed cross-market action led by strong energy gains.
Equity ETFs and Mag7:
Major Index ETFs were broadly Bearish: SPY -1.54%, IWM -1.64%, IJH -1.71%, QQQ -2.04%, and DIA -2.18%; SPY was the least negative mover and DIA was the most bearish index ETF. Mag7 action was selective, with GOOG the only Bullish name at +0.95%, while AAPL -0.56%, MSFT -0.71%, META -1.31%, AMZN -1.82%, TSLA -2.97%, and NVDA -3.55% were Bearish. GOOG was the most bullish equity mover, while NVDA was the most bearish mover.
Cross-Market ETFs:
Cross-market ETFs were Mixed, with USO strongly Bullish at +7.32% and GLD Bullish at +0.46%, diverging from Bearish equities. TLT was Bearish at -1.65% and IBIT was Bearish at -0.39%; USO was the most bullish mover, while TLT was the most bearish mover.
Futures Indices – Higher Time Frame Analysis
Summary of the current state of US Indices Futures based on higher time-frame (HTF) technical analysis as of: 2026-07-30: 07:16 CT.
US Indices Futures
- ES: YSFG above, MSFG/WSFG below, declining short MAs, 7693.50 resistance, 7492.00 reversal pivot, 7324.00-7308.50 support; short-term corrective.
- NQ: YSFG above, MSFG/WSFG below, short MAs declining, 27201.50 support, 28498.00 reversal pivot, 29938.00 resistance; volatile downswing.
- YM: YSFG above, MSFG/WSFG below, long MAs rising, 51630 support, 52818 reversal pivot, 53105-53666 resistance; mixed weekly structure.
- EMD: YSFG above, MSFG/WSFG below, short MAs declining, 3730.5-3724.0 support, 3832.9-3892.4 resistance; weekly higher-low structure intact.
- RTY: YSFG above, MSFG/WSFG below, declining short MAs, 2901.9 support, 2828.1 then 2748.8 support, 3068.4 resistance; consolidation.
- FDAX: YSFG/MSFG/WSFG above, all benchmarks rising, 25678 then 26064 resistance, 24960 reversal pivot, 24715 support; aligned bullish structure.
Overall State
- Short-Term: Bearish
- Intermediate-Term: Neutral
- Long-Term: Bullish
Conclusion
US indices are broadly below weekly and monthly Fib-grid centers, with short-term down pivots and declining near-term benchmarks correlated across ES, NQ, YM, EMD, and RTY. Yearly Fib positioning and rising long-term benchmarks retain bullish long-term structure. FDAX remains the relative leading instrument, holding above all Fib-grid centers and benchmarks while testing resistance.
Note: Intra-day counter-trend pullbacks or retracements may occur, HTF is context for informational usage and market structure. Glossary: Session Fib Grids periods of YSFG:’Yearly’, MSFG:’Monthly’, WSFG:’Weekly’
For full details visit: AlphaWebTrader Technicals
ES Daily View
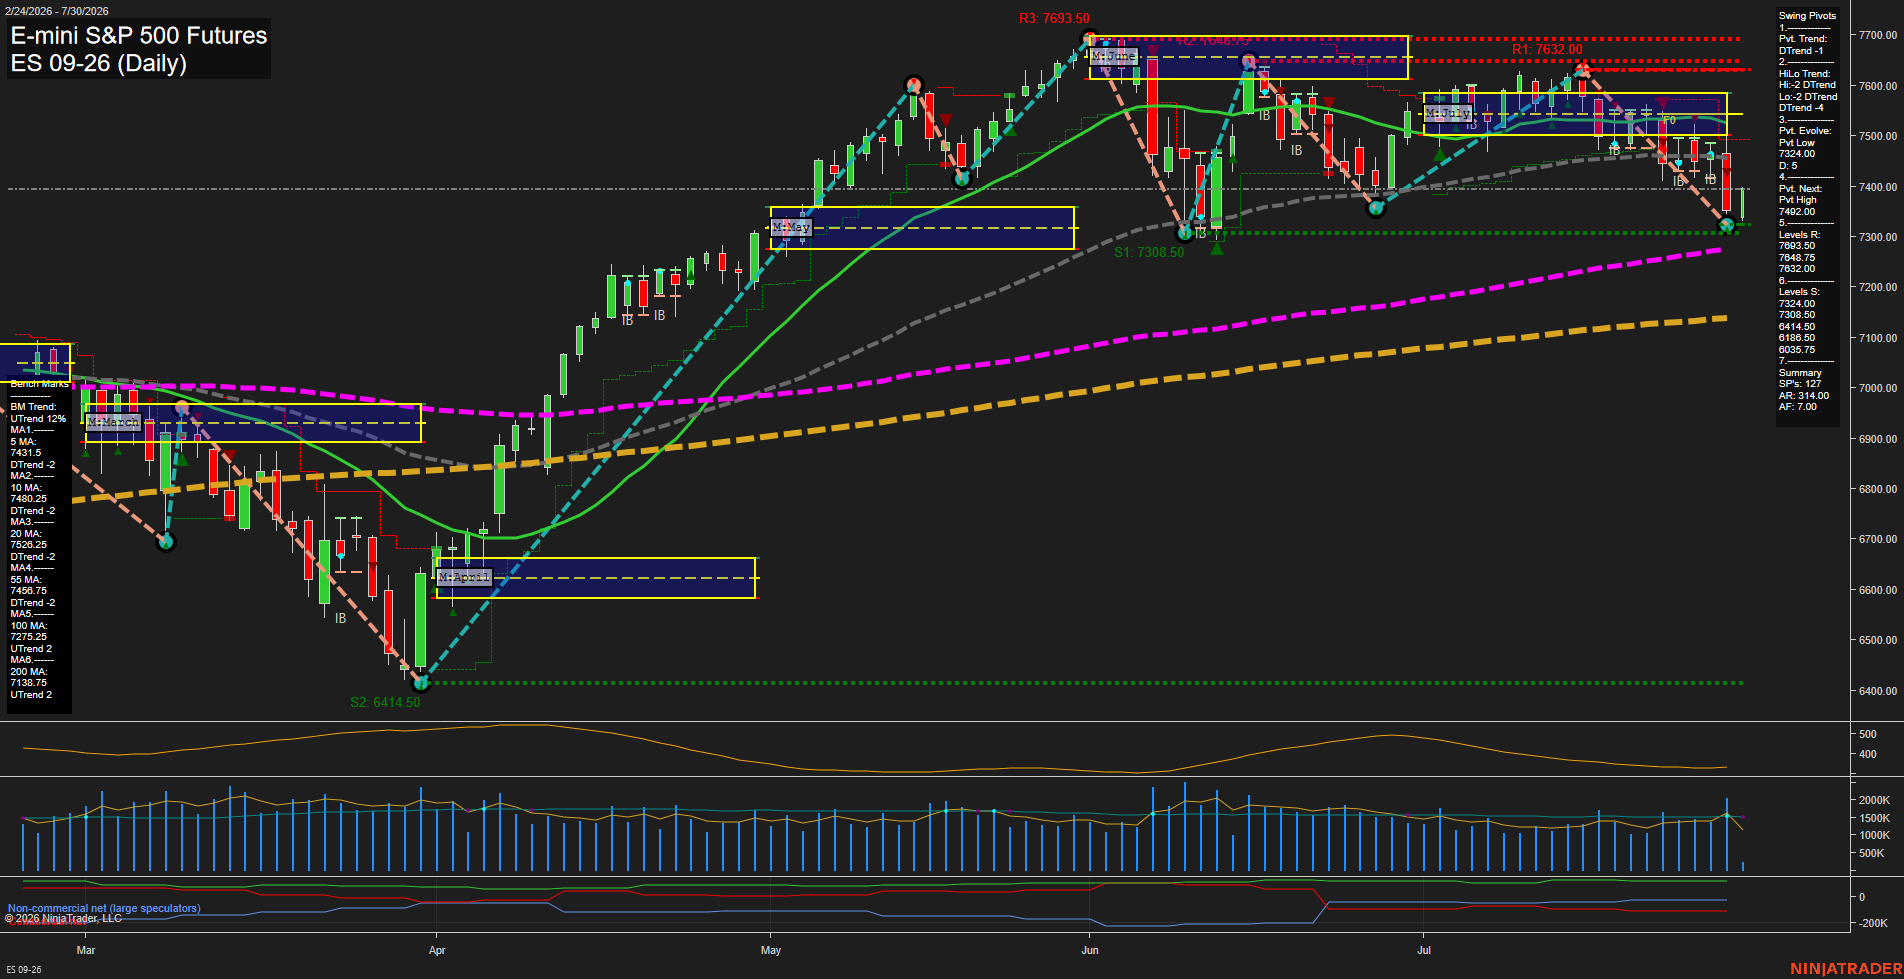
Overall Rating
- Short-Term: Bearish
- Intermediate-Term: Bearish
- Long-Term: Bullish.
Key Insights Summary
Daily structure reflects a fast short-term selloff, with price below the weekly and monthly Fib-grid centers and beneath all short- and intermediate-term benchmarks. Both pivot trends are down, confirming lower-high/lower-low behavior; 7492.00 defines the next pivot reversal threshold, while the 7324.00 to 7308.50 support band is the immediate downside test area. The broader 2026 structure remains constructive because price is above rising 100-day and 200-day benchmarks, framing the current decline as an intermediate-term retracement within a longer-term advance.
View charts on: AlphaWebTrader HTF Charts
NQ Daily View
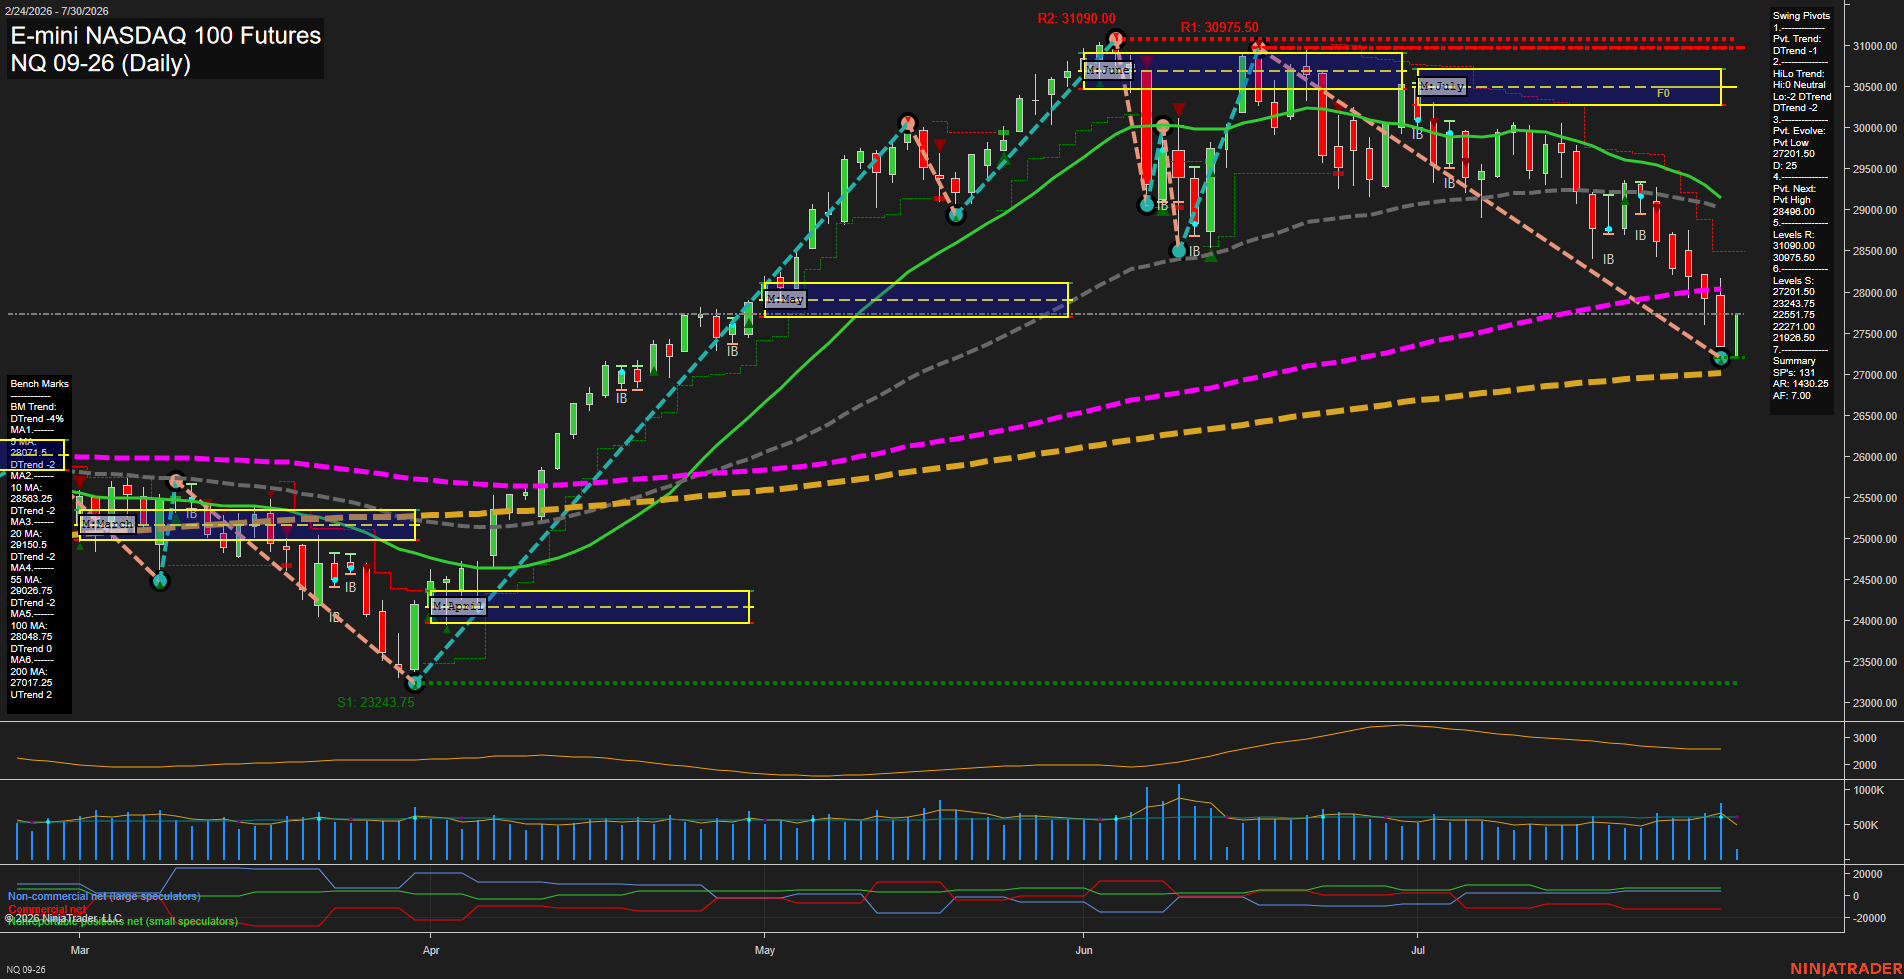
Overall Rating
- Short-Term: Bearish
- Intermediate-Term: Bearish
- Long-Term: Bullish.
Key Insights Summary
Price is in a fast, high-volatility downswing beneath the weekly and July monthly F0%/NTZ structures and below all short- through intermediate-term benchmarks. The late-July decline has produced lower highs and lower lows, while the 27201.50 pivot-low area is being tested near the rising 200-day average at 27017.25. The developing bounce is counter-trend within the short-term DTrend; 28498.00 is the next pivot-reversal reference. The annual grid remains positive and the 200-day benchmark is rising, preserving a longer-term bullish structural backdrop despite the current intermediate-term retracement.
View charts on: AlphaWebTrader HTF Charts
CL Daily View
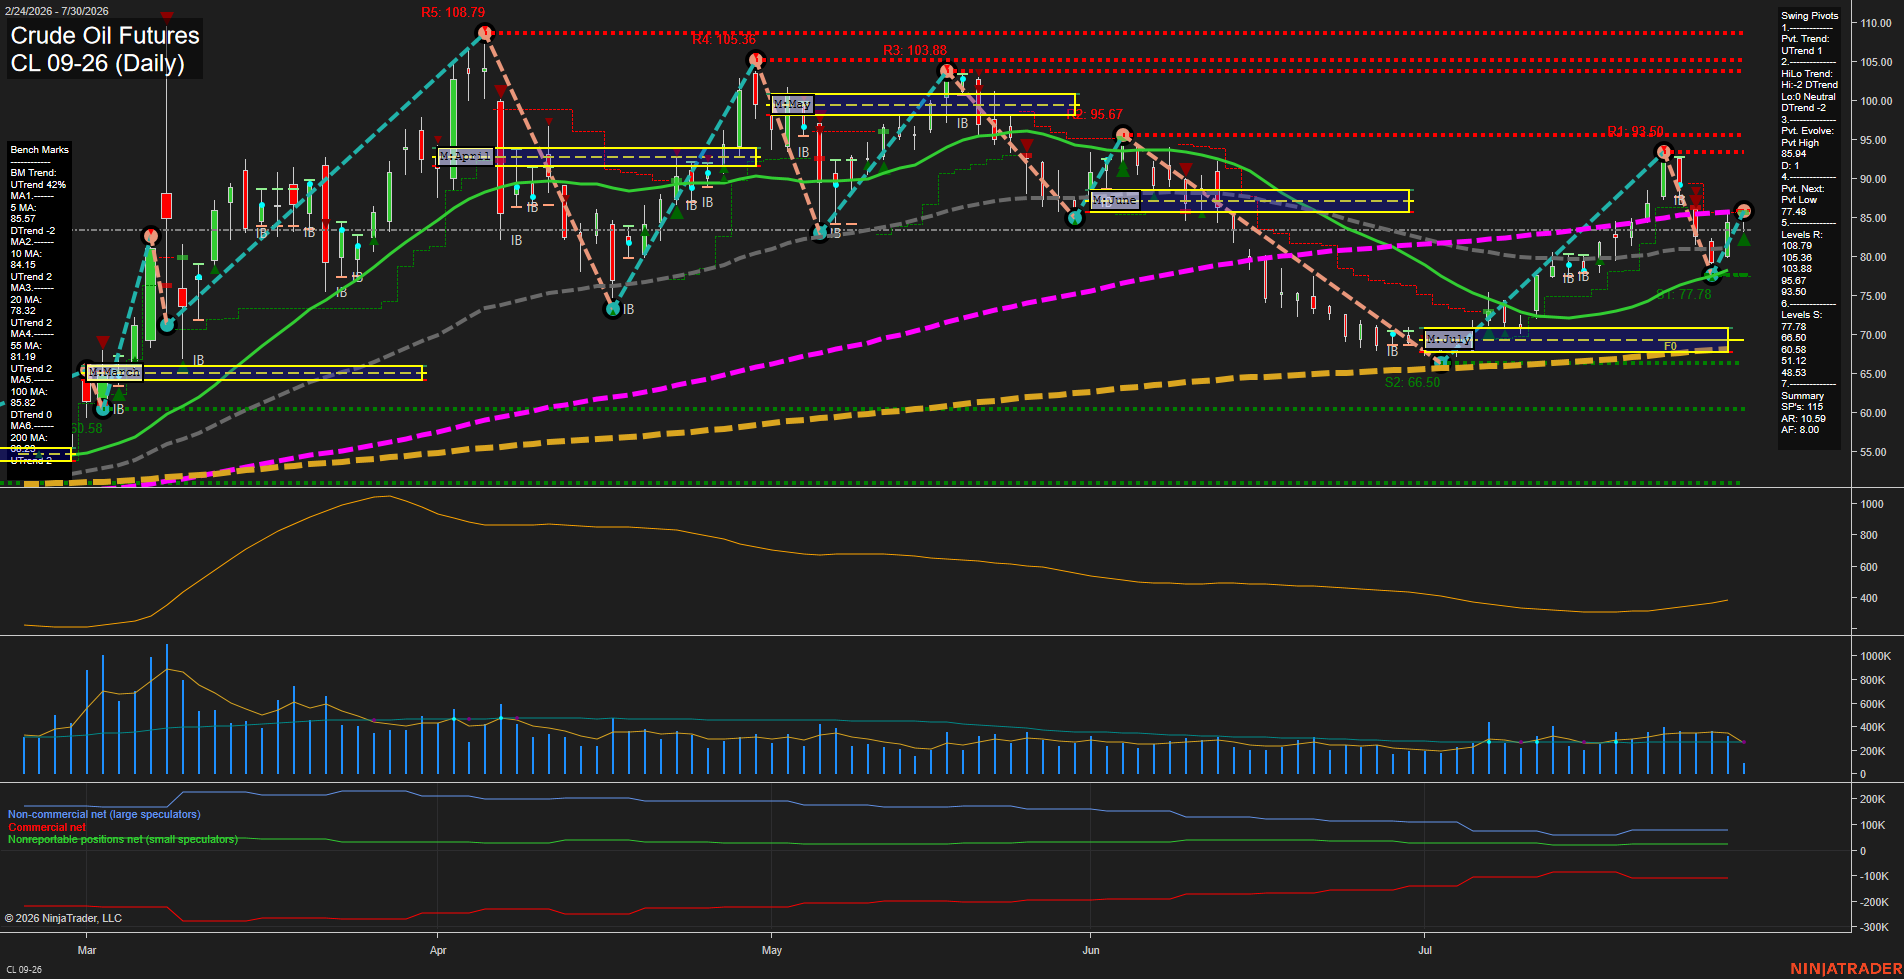
Overall Rating
- Short-Term: Neutral
- Intermediate-Term: Bullish
- Long-Term: Bullish.
Key Insights Summary
Price is consolidating near 85.48 after a sharp July recovery from the 66.50 area. The short-term pivot structure has turned higher, but the weekly Fib grid remains down and the 5-day average is marginally declining, creating a mixed near-term condition. Intermediate structure remains constructive above rising 20- and 55-day benchmarks, while the longer-term yearly grid and rising 200-day average retain an upward bias. The 85.82 to 93.50 zone marks nearby overhead resistance, while 77.78 is the key swing support beneath the current recovery structure.
View charts on: AlphaWebTrader HTF Charts
GC Daily View
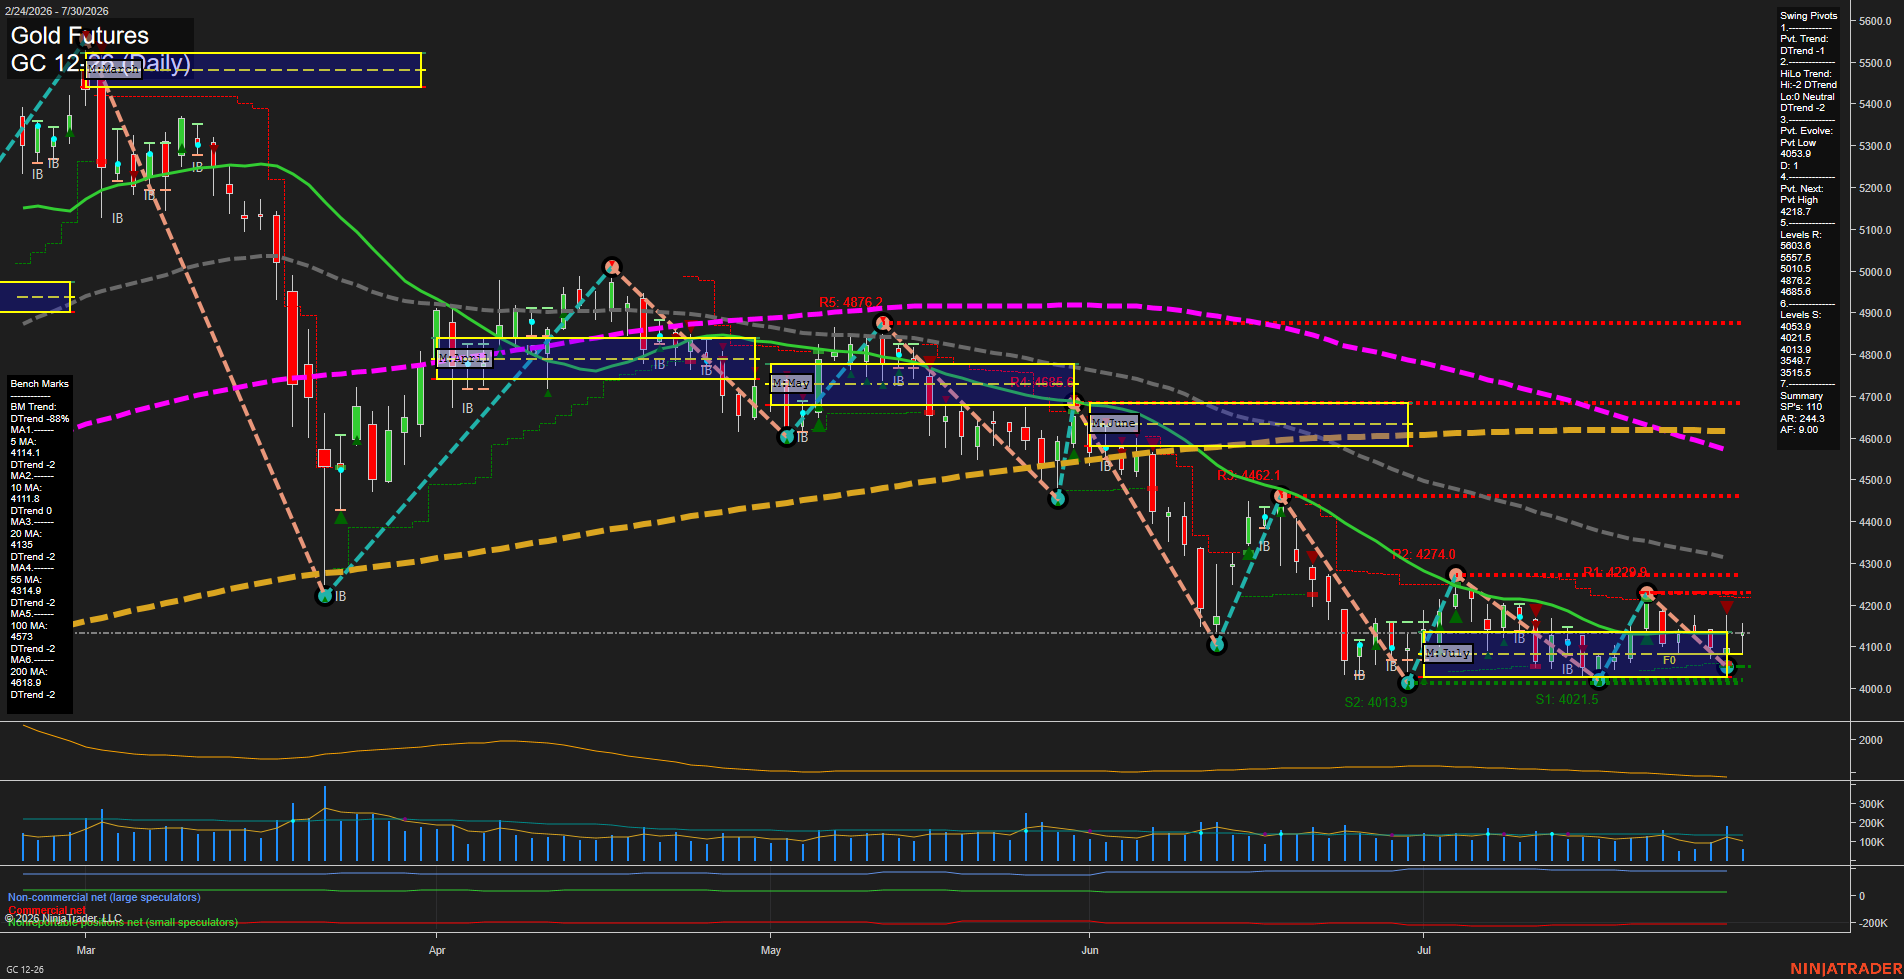
Overall Rating
- Short-Term: Bearish
- Intermediate-Term: Bearish
- Long-Term: Bearish.
Key Insights Summary
Gold is consolidating in a narrow July range near 4112 following a broader decline from the June and May highs. The short-term pivot structure remains in DTrend, with price holding only marginally above the 10-day benchmark while remaining below the declining 5-, 20-, 55-, 100-, and 200-day averages. The 4053.9 pivot low and clustered 4021.5-4013.9 supports define the lower edge of the current compression, while 4218.7 is the next pivot-reversal threshold. July MSFG remains positive above its F0% area, representing a counter-trend monthly bounce inside a bearish intermediate and long-term structure. Small daily bars and subdued volume indicate slow momentum and choppy consolidation rather than a decisive trend expansion.
View charts on: AlphaWebTrader HTF Charts