U.S. stocks fell as Middle East tensions pushed Brent above $100 and Treasury yields higher, intensifying inflation and Fed policy concerns.
Fundamentals: U.S. equities extended their decline as escalating Middle East conflict heightened oil supply concerns, lifting Brent crude above $100 and WTI above $95. Treasury yields reached fresh multiyear highs despite a $6 billion debt buyback, adding to inflation and Federal Reserve policy focus. Energy shares outperformed while small caps and broader risk assets weakened.
Technicals: META, USO and GLD led ETF gainers, while AAPL, AMZN and GOOG declined. Futures analysis showed bearish short-term conditions across ES, NQ, YM, RTY and FDAX, with several markets below key Fibonacci zones and short-term averages after recent highs. Longer-term structures remained broadly bullish, supported by rising 100- and 200-period benchmarks.
After Market Close daily snapshot: market news summary and sentiment, major ETFs, Magnificent 7 analysis, Indices Futures Higher Time Frame Analysis, and E-mini S&P500, Nasdaq 100, NYMEX Crude, Gold Futures Daily Chart analysis.
As of: September 9, 2026 05:00 CT
Market News Summary:
Equities declined as Middle East escalation lifted oil above $100 and Treasury yields rose despite a $6 billion debt buyback.
Primary Drivers & Risks:
- Primary Driver: Oil spike and rising yields
- Primary Risk: Inflation and rate-hike pressure
Tone:
Risk-off, with energy strength offset by broad equity pressure.
Stock Market / ETFs / Indices:
U.S. stocks extended their decline, with S&P 500 selling linked to $100 Brent, firm yields, and elevated Fed concerns. Small-cap stocks fell below a key chart level, while yen strength added pressure to global risk assets. Energy-related equities and ETFs outperformed amid the crude rally.
Geopolitical:
Escalation in the Middle East, including reported U.S. strikes on Iran-linked tankers near the Strait of Hormuz, intensified supply-disruption concerns. U.S.-Canada trade tensions and tariffs on autos and alcohol also remained an inflationary corporate headwind.
Oil / Energy:
Brent crude rose above $100 a barrel and WTI moved above $95 after tanker attacks and broader Middle East conflict escalation. Reports highlighted shrinking inventories, China demand, and supply fears; natural gas and energy-sector positioning also drew attention.
Gold / Metals:
Silver rose as dollar selling outweighed higher Treasury yields ahead of inflation data and the Fed meeting. Gold traded within a cited consolidation range, with attention on a potential technical breakout.
Fed / Financials:
Treasury yields climbed to fresh multiyear highs after the Treasury announced $6 billion in longer-dated debt repurchases, signaling investor dissatisfaction with the purchase size. Rising consumer and wholesale inflation reports placed focus on the Fed’s next policy decision and rate-hike discussion.
Macro / Other:
A stronger Japanese yen signaled increased Bank of Japan tightening concerns and unsettled FX and risk markets. Higher oil prices and tariffs added to inflation concerns, while Citgo’s governance transition introduced refinery-sector uncertainty.
Conclusion:
The dominant session drivers were the Middle East conflict, oil above $100, and rising Treasury yields. These forces coincided with continued U.S. equity selling and relative energy-sector strength.
Inflation data and Fed policy attention remain key cross-currents. Yen appreciation, trade tariffs, weak small-cap technicals, and concerns around elevated equity valuations added to market caution.
Market News Sentiment
Market News Articles: 23
- Neutral: 43.48%
- Negative: 30.43%
- Positive: 26.09%
Sentiment Summary: Market news sentiment is mixed, with 43% neutral coverage, 30% negative coverage, and 26% positive coverage across 23 articles.
Conclusion: Neutral articles are the largest category, while negative sentiment exceeds positive sentiment.
GLD,Gold Articles: 4
- Neutral: 50.00%
- Positive: 50.00%
Sentiment Summary: GLD/Gold coverage is evenly split, with 50% positive and 50% neutral sentiment across 4 articles.
Conclusion: Gold-related news flow is balanced, with no negative sentiment reported in the snapshot.
USO,Oil Articles: 13
- Positive: 61.54%
- Neutral: 23.08%
- Negative: 15.38%
Sentiment Summary: USO/Oil coverage is moderately positive, with 62% positive, 23% neutral, and 15% negative articles.
Conclusion: Oil-related news tone is predominantly positive, which is relevant to energy-sector sensitivity within index futures.
Market Data Snapshot
ETF Snapshot of major stock market ETFs, Mag7, and others as of: September 9, 2026 05:00
Top Movers & Losers
- META 651.63 Bullish 6.22% ▲
- USO 148.72 Bullish 1.84% ▲
- GLD 404.97 Bullish 1.31% ▲
- AAPL 311.84 Bearish -1.39% ▼
- AMZN 252.18 Bearish -1.86% ▼
- GOOG 328.72 Bearish -1.99% ▼
Major Index ETFs: SPY, QQQ, DIA, IWM, IJH
- QQQ 716.10 Bearish -0.31% ▼
- SPY 762.78 Bearish -0.42% ▼
- DIA 524.85 Bearish -0.60% ▼
- IJH 74.66 Bearish -0.93% ▼
- IWM 290.96 Bearish -1.26% ▼
Major Index ETFs are Bearish across the group. IWM is the most bearish mover at -1.26%, followed by IJH at -0.93% and DIA at -0.60%. SPY declined -0.42%, while QQQ is the least negative mover at -0.31%.
Mag 7 Stocks: AAPL, MSFT, GOOG, AMZN, META, NVDA, TSLA
- META 651.63 Bullish 6.22% ▲
- TSLA 368.68 Bullish 0.14% ▲
- MSFT 493.12 Bearish -0.17% ▼
- NVDA 224.37 Bearish -0.60% ▼
- AAPL 311.84 Bearish -1.39% ▼
- AMZN 252.18 Bearish -1.86% ▼
- GOOG 328.72 Bearish -1.99% ▼
Mixed Mag7 conditions: META is the most bullish mover at +6.22%, while GOOG is the most bearish mover at -1.99%. TSLA is marginally Bullish at +0.14%; MSFT is near-flat Bearish at -0.17%. NVDA, AAPL, and AMZN are Bearish at -0.60%, -1.39%, and -1.86%, respectively.
Cross-Market ETFs: TLT, GLD, USO, IBIT
- USO 148.72 Bullish 1.84% ▲
- GLD 404.97 Bullish 1.31% ▲
- IBIT 44.59 Bullish 0.45% ▲
- TLT 81.81 Bearish -0.47% ▼
Other ETFs are Mixed: USO is the most bullish mover at +1.84%, followed by GLD at +1.31% and IBIT at +0.45%. TLT is the most bearish mover at -0.47%.
ETF, Mag7, and Cross-Market ETF Insights
Overall Tone
Mixed, with broad equity ETF weakness offset by concentrated META strength and Bullish moves in USO, GLD, and IBIT.
Equity ETFs and Mag7:
Major Index ETFs were Bearish across the board: SPY -0.42%, QQQ -0.31%, DIA -0.60%, IJH -0.93%, and IWM -1.26%, with IWM the most bearish ETF mover and QQQ the least negative. Mag7 action was selective, led by META at +6.22%, the most bullish mover overall, while GOOG at -1.99% was the most bearish Mag7 mover; TSLA was marginally Bullish at +0.14% and MSFT was near-flat Bearish at -0.17%.
Cross-Market ETFs:
Cross-market ETFs were Mixed versus Bearish equity ETFs, with USO leading at +1.84% as the most bullish cross-market mover, followed by GLD +1.31% and IBIT +0.45%. TLT was the only Bearish cross-market ETF at -0.47%, making it the most bearish mover in the group.
Futures Indices – Higher Time Frame Analysis
Summary of the current state of US Indices Futures based on higher time-frame (HTF) technical analysis as of: 2026-09-09: 17:00 CT.
US Indices Futures
- ES YSFG constructive, MSFG/WSFG below F0%, declining 5-day benchmark, 7475 swing support, 7838.50 resistance, 7551.25–7633.25 benchmark support.
- NQ YSFG constructive, MSFG/WSFG below F0%, 20/55-day benchmarks rising, 28927.25–29002.25 support, 29811.50 then 30343 resistance.
- YM YSFG constructive, MSFG/WSFG below F0%, below 5–55-day benchmarks, 52475 support, 51630/51948 lower support, 53437–53862 resistance.
- EMD YSFG constructive, MSFG/WSFG below F0%, below 10–55-day benchmarks, 3713.8/3692.9 support, 3797.4 resistance, 3917.6–3941.7 pivot zone.
- RTY YSFG constructive, MSFG/WSFG below F0%, declining 10–55-day benchmarks, 2914.5–2902.3 support, 2983.3 resistance, 3079.9 overhead pivot.
- FDAX YSFG constructive, MSFG/WSFG below centers, beneath 5–20-day benchmarks, 25592 support, 26010 reversal pivot, 26665 resistance.
Overall State
- Short-Term: Bearish
- Intermediate-Term: Bearish
- Long-Term: Bullish
Conclusion
US index futures show correlated short-term corrective pressure, with ES, NQ, YM, RTY, and FDAX below weekly and monthly Fib-grid centers. EMD is consolidating below these centers. Daily benchmark slopes and clustered short signals align with the pullback, while yearly Fib grids and rising longer-term benchmarks maintain the broader bullish structure. YM and FDAX show the clearest intermediate weakness; EMD and RTY retain countertrend upward pivot characteristics near support.
Note: Intra-day counter-trend pullbacks or retracements may occur, HTF is context for informational usage and market structure. Glossary: Session Fib Grids periods of YSFG:’Yearly’, MSFG:’Monthly’, WSFG:’Weekly’
For full details visit: AlphaWebTrader Technicals
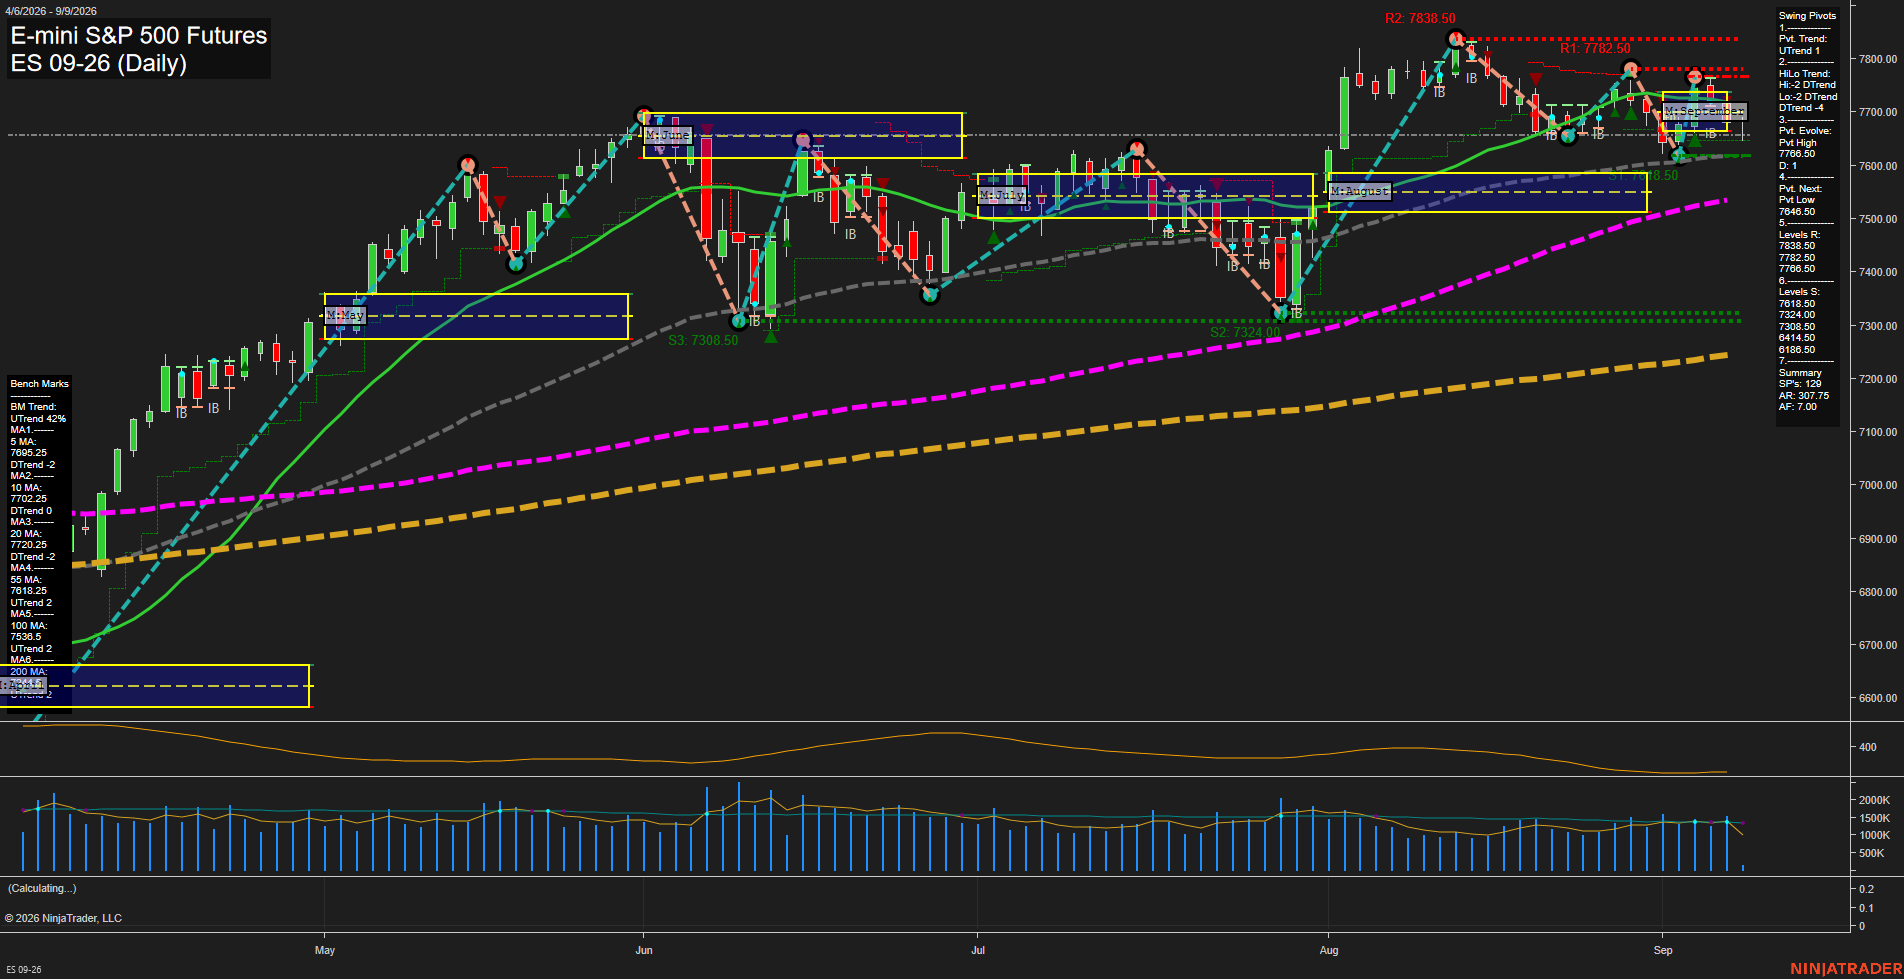
ES Daily View
Overall Rating
- Short-Term: Bearish
- Intermediate-Term: Bearish
- Long-Term: Bullish.
Key Insights Summary
Price is consolidating beneath declining 5-, 10-, and 20-day benchmarks after rejection from the 7766.50 pivot-high area. The short-term pivot structure remains
View charts on: AlphaWebTrader HTF Charts
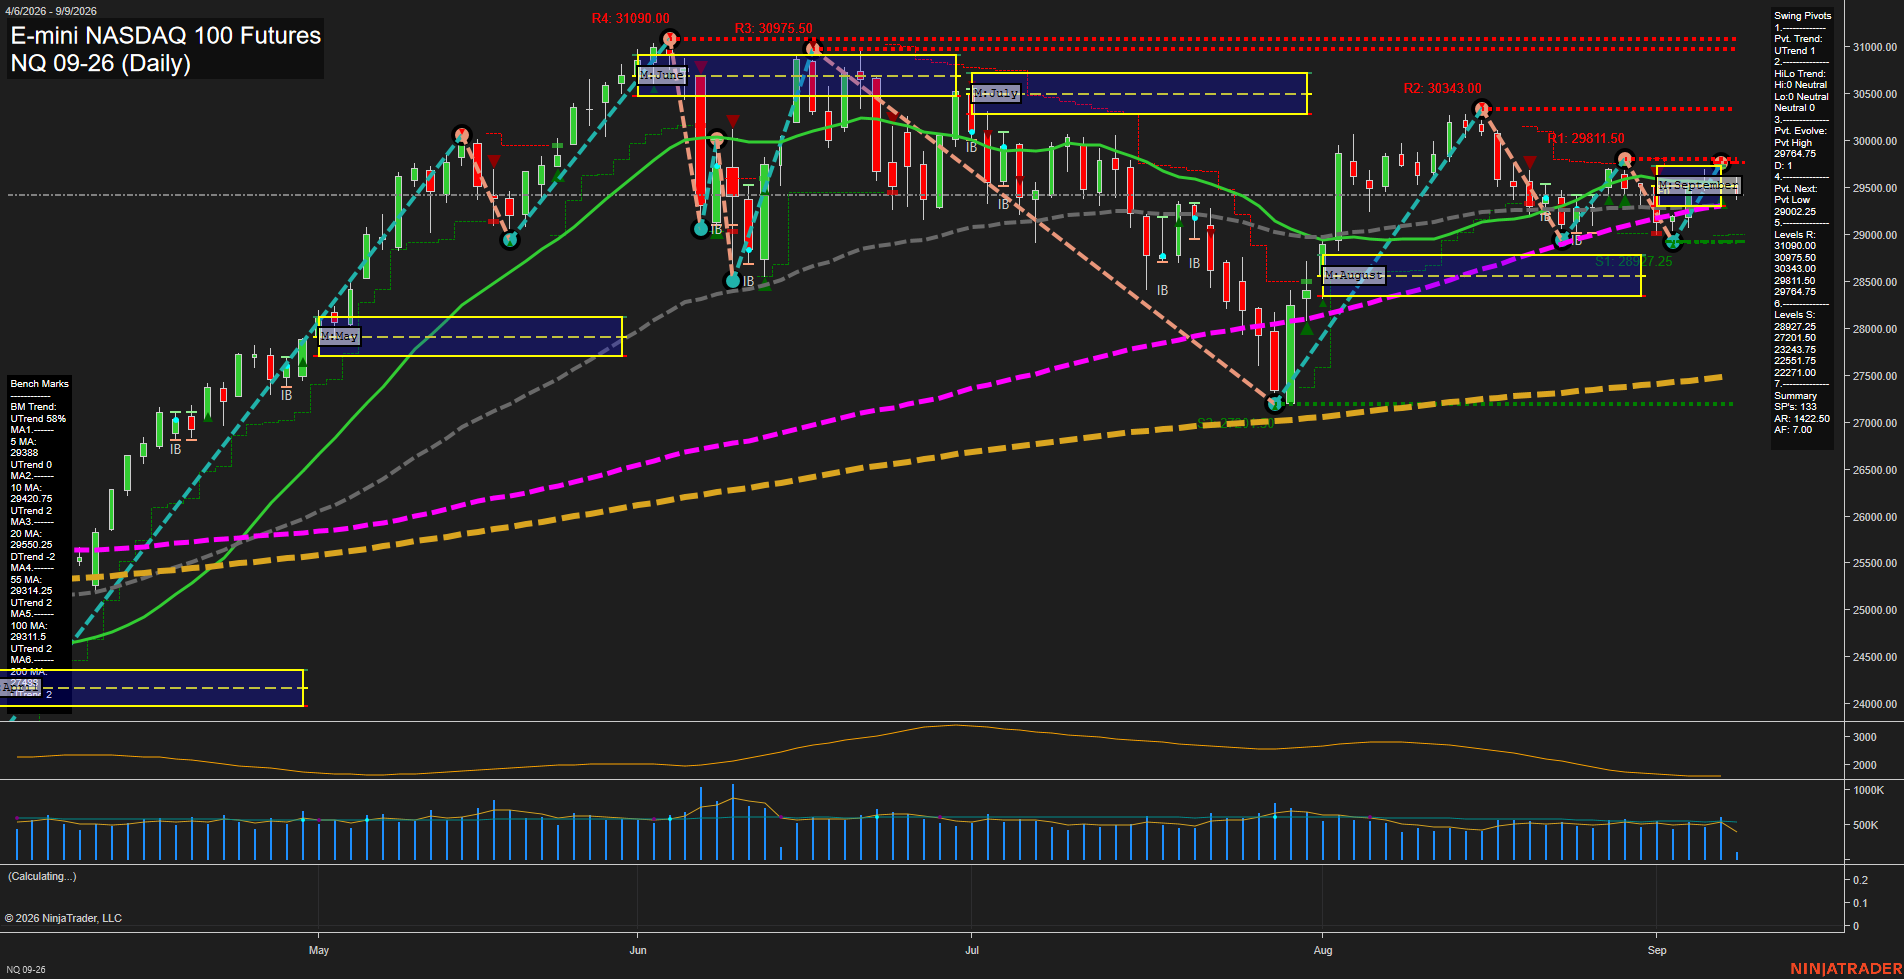
NQ Daily View
Overall Rating
- Short-Term: Bearish
- Intermediate-Term: Neutral
- Long-Term: Bullish.
Key Insights Summary
Price is consolidating beneath the September MSFG F0% area and the declining 20-day benchmark after rejection from the 29742.75 pivot high. Short-term structure remains pressured by the weekly grid and fresh short signals, while the 55-day and 100-day benchmarks remain upward sloping near current price. The 28927.25 to 29002.25 area defines the nearby pivot-support zone, with 29811.50 the first meaningful overhead pivot resistance. The broader yearly structure remains constructive above the rising 200-day average, while declining ATR and smaller daily ranges reflect a compressed, slower momentum phase.
View charts on: AlphaWebTrader HTF Charts
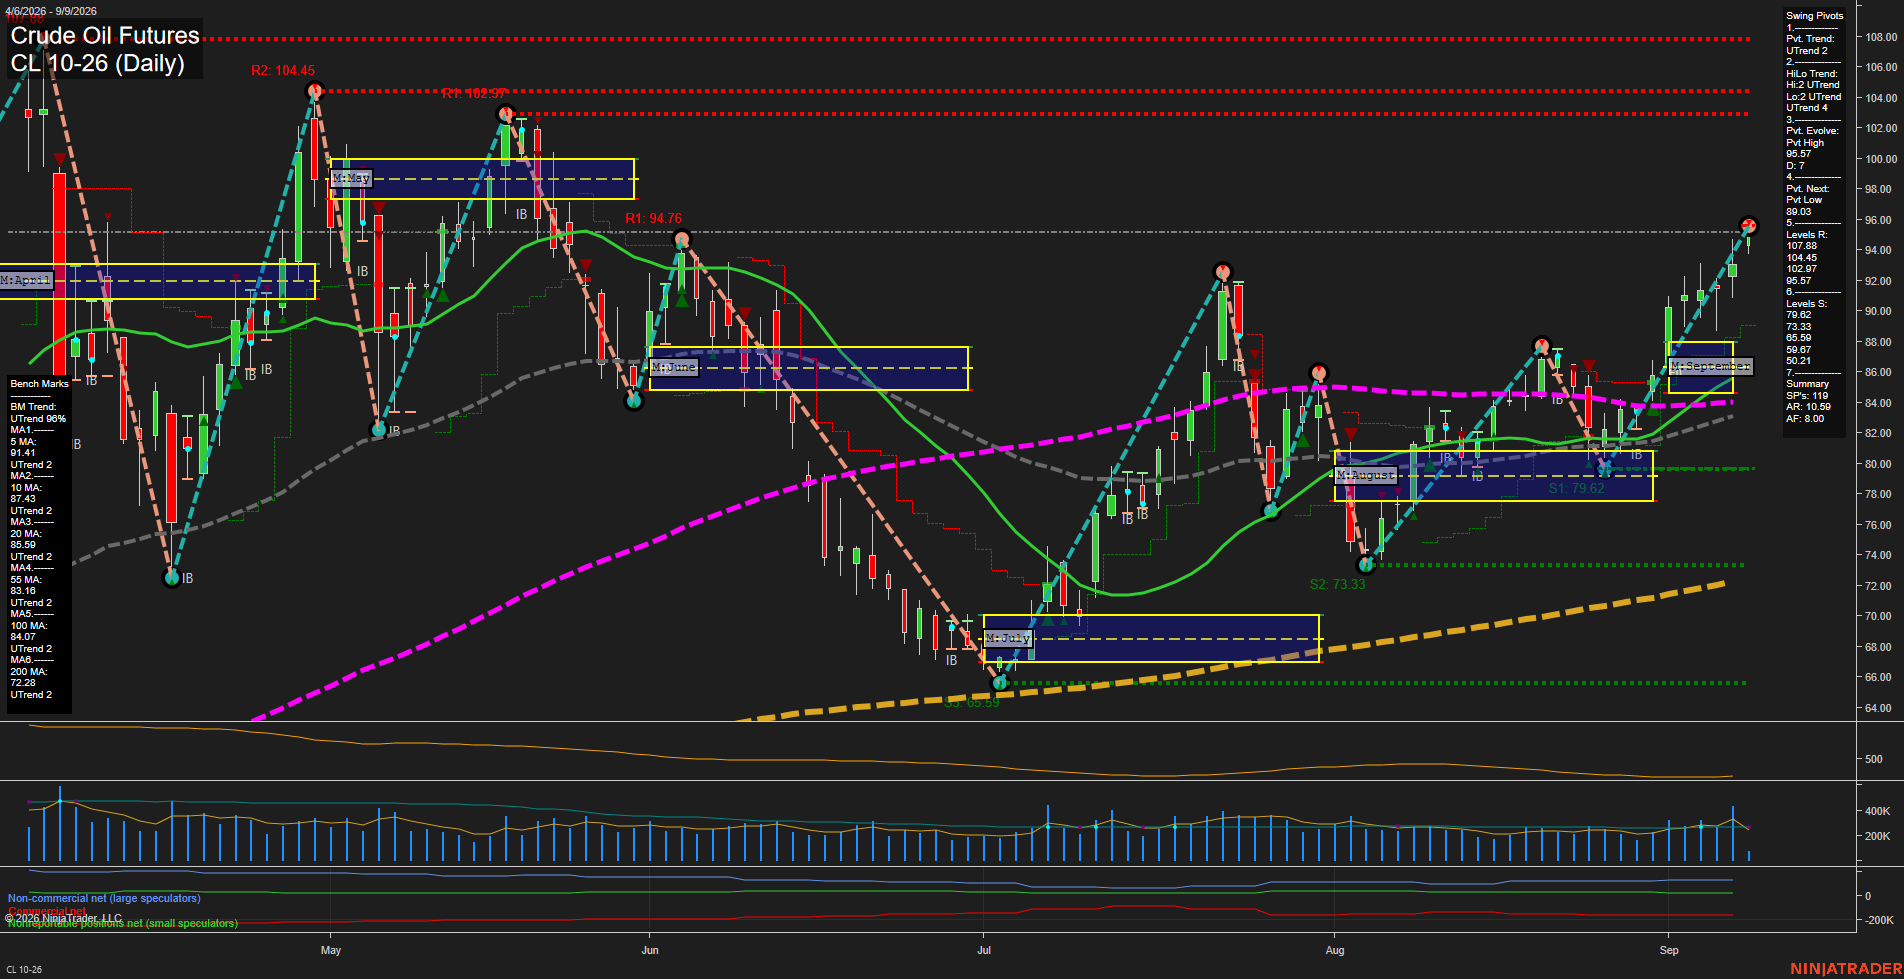
CL Daily View
Overall Rating
- Short-Term: Bullish
- Intermediate-Term: Bullish
- Long-Term: Bullish.
Key Insights Summary
Price is in a fast, medium-range upside expansion, holding above every daily benchmark and above the weekly, monthly, and yearly fib-grid reference areas. The pivot structure remains aligned upward across short- and intermediate-term measures, with the current advance approaching the 95.57 pivot-high resistance. The recovery from the August 79.62 support area has developed into a higher-low, higher-high sequence; 90.62 is the nearest structural support beneath the current rally. Longer-term trend structure remains firmly positive, supported by the rising 100-day and 200-day averages, while the elevated daily range reflects active swing volatility.
View charts on: AlphaWebTrader HTF Charts
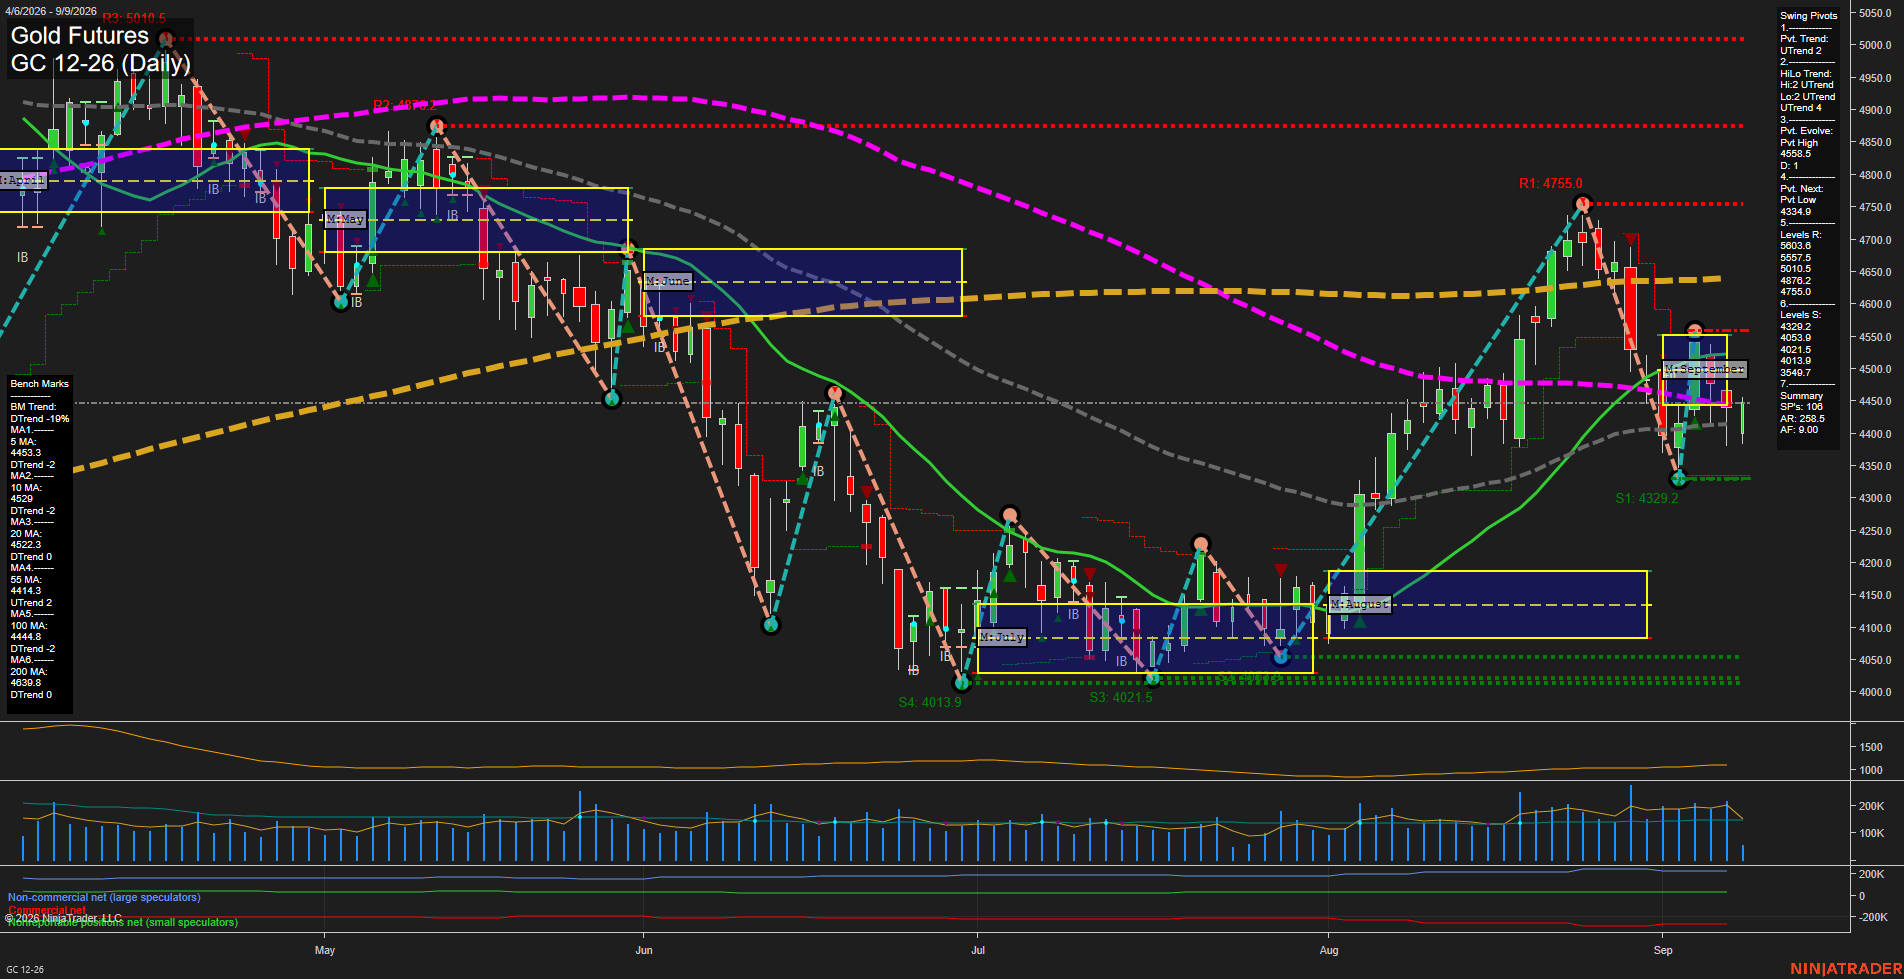
GC Daily View
Overall Rating
- Short-Term: Bearish
- Intermediate-Term: Bearish
- Long-Term: Bearish.
Key Insights Summary
GC remains in a broad bearish technical structure, with price below the weekly and monthly Fib-grid centers and beneath the declining 5-, 10-, 20-, 100-, and 200-day benchmarks. The short-term pivot structure remains classified as an uptrend following the rebound from 4329.2, but the recovery is trading below nearby moving-average resistance around 4444.8 to 4529.0. The September rally failed beneath the 4755.0 pivot resistance area and reversed sharply, leaving 4334.9 as the active downside pivot threshold. The 55-day average at 4414.3 is the immediate stabilizing reference, while 4329.2 is the principal nearby support; a loss of that level returns focus to the 4033.9 to 4013.9 support cluster. Elevated ATR reflects a volatile, wide-swing environment with a counter-trend rebound developing inside a larger downtrend.
View charts on: AlphaWebTrader HTF Charts