NYSE pre-market update: Brent crude tops $100 on U.S.-Iran tensions, lifting yields and weighing on futures ahead of U.S. inflation data release.
Fundamentals: U.S. index futures weakened as escalating U.S.-Iran conflict and Gulf shipping disruptions pushed Brent crude above $100 and raised inflation concerns. Higher energy prices lifted Treasury yields ahead of U.S. price data, while gold and silver drew safe-haven interest. Trade frictions, elevated borrowing costs, and concentrated equity-market exposure added to the risk backdrop.
Technicals: Tesla and USO led prior-session ETF gains, while GLD, IBIT and Nvidia declined. Futures technical readings show short-term bearish pressure in ES, NQ, YM, RTY and FDAX following recent resistance rejections, with key support and pivot levels in focus. Longer-term trend structures remain broadly bullish across major equity-index futures despite intermediate corrective activity.
Pre-Market Trading 360° view Market Radar of: holidays, earnings, eco-news, market-news summary, news sentiment, prior session major ETFs, MAG7, Higher Time Frame Analysis Indices Futures Summary, and E-mini S&P500, Nasdaq 100, NYMEX Crude, Gold Futures Daily Chart analysis.
As of: September 9, 2026 07:16 CT
Earnings Radar
Monitoring for earnings releases by the Magnificent 7, AI-tech-related firms, and major financial institutions.
- ADBE Release: 2026-09-10 T:AMC
- ORCL Release: 2026-09-10 T:AMC
Conclusion: Adobe and Oracle report after the close on 2026-09-10, placing enterprise software, cloud, AI-related demand, and technology-sector positioning in focus for index futures. Market momentum and volume can slow ahead of these major tech earnings releases.
For full details visit: Yahoo Earnings Calendar
EcoNews Radar U.S. Events
| Day | Time | Impact | Event |
|---|---|---|---|
| Thu | 08:30 | High | Core PPI m/m |
| Thu | 08:30 | High | PPI m/m |
| Thu | 08:30 | Medium | Unemployment Claims |
| Thu | 12:00 | Low | Crude Oil Inventories |
| Fri | 08:30 | High | Core CPI m/m |
| Fri | 08:30 | High | Core CPI y/y |
| Fri | 08:30 | High | CPI m/m |
| Fri | 08:30 | High | CPI y/y |
| Fri | 10:00 | Medium | Prelim UoM Consumer Sentiment |
| Fri | 10:00 | Medium | Prelim UoM Inflation Expectations |
EcoNews Summary
Thursday features producer-inflation data, followed by Friday’s consumer-inflation releases. These reports frame inflation conditions at the business and household levels and carry significant relevance for index-futures pricing, interest-rate expectations, and broad market volatility.
Event Notes:
- Thursday 08:30 – Core PPI m/m: Measures the monthly change in producer prices excluding food and energy. Traders monitor it for underlying pipeline inflation pressures.
- Thursday 08:30 – PPI m/m: Measures the monthly change in prices received by domestic producers. It provides insight into wholesale inflation and potential pressure on consumer prices.
- Friday 08:30 – Core CPI m/m: Measures the monthly change in consumer prices excluding food and energy. It is a key reading of underlying consumer inflation.
- Friday 08:30 – Core CPI y/y: Measures annual consumer inflation excluding food and energy. It is closely monitored for the broader trend in persistent inflation.
- Friday 08:30 – CPI m/m: Measures the monthly change in the overall consumer price level, including food and energy.
- Friday 08:30 – CPI y/y: Measures the annual change in the overall consumer price level and provides a headline view of inflation faced by households.
Conclusion:
The single most important event is Friday’s 08:30 Core CPI y/y release, alongside the full CPI release set. Market momentum and volume often slow ahead of major events such as CPI, with increased volatility at release time. Thursday’s PPI data provides earlier inflation context ahead of Friday’s consumer-price readings.
For full details visit: Forex Factory EcoNews
Market News Summary:
Escalating U.S.-Iran conflict lifted oil above $100, raised Treasury yields, and pressured U.S. index futures ahead of inflation data.
Primary Drivers & Risks:
- Primary Driver: Iran conflict lifts oil prices
- Primary Risk: Persistent energy-driven inflation pressure
Tone:
Risk-off, with energy and geopolitical stress dominating.
Stock Market / ETFs / Indices:
U.S. futures weakened after Brent briefly exceeded $100: Dow futures fell more than 300 points, while S&P 500 and Nasdaq 100 futures declined about 0.2%. Earlier mixed equity-market conditions reflected modest benchmark gains alongside sector weakness. Commentary also highlighted concentrated AI exposure among major S&P 500 constituents and elevated vulnerability to shocks.
Geopolitical:
U.S.-Iran military exchanges intensified after U.S. forces destroyed Iranian crude tankers and Iran reported attacks on U.S. vessels and oil tankers. Gulf shipping disruption and Houthi attacks on Saudi cities added to regional tensions. U.S.-China technology-security accusations and an escalation in U.S.-Canada trade restrictions added separate cross-border frictions.
Oil / Energy:
Brent crude briefly crossed $100 per barrel for the first time since July, while WTI approached $95, as threats around the Strait of Hormuz and lower Iranian exports tightened physical supply. Iraq’s request for a higher OPEC+ output quota appeared alongside the supply disruption backdrop. Natural gas weakened below $2.92 despite the oil rally.
Gold / Metals:
Gold and silver received safe-haven support from Middle East tensions while traders awaited U.S. inflation data. Gold held near support but remained below cited resistance; silver required a move above $72 to extend its recovery.
Fed / Financials:
Higher oil prices pushed Treasury yields higher and revived inflation concerns ahead of key U.S. price data. Broader rate pressure and heavy municipal-bond issuance lifted tax-exempt yields. The average 30-year fixed mortgage rate increased to 6.85%, while demand for adjustable-rate mortgages rose.
Macro / Other:
Recent data portrayed steady growth and low unemployment, while consumer concerns remained centered on rising living costs. Federal deficit concerns persisted after the U.S. deficit crossed $40 trillion. Commodities gained 6.21% in August, and managed futures rose 2.75% for the month.
Conclusion:
Oil prices, Gulf conflict developments, Treasury yields, and U.S. inflation data are the central index-futures drivers. Higher energy costs are the immediate link between geopolitics and inflation concerns.
Trade tensions involving Canada and China add to the risk backdrop. Equity-market concentration concerns, fiscal deficits, and higher borrowing costs remain additional cross-currents.
Market News Sentiment
Market News Articles: 19
- Neutral: 57.89%
- Negative: 31.58%
- Positive: 10.53%
Sentiment Summary: Of 19 market news articles, 58% were neutral, 32% negative, and 11% positive, indicating predominantly neutral coverage with a negative tilt.
Conclusion: Indices futures day traders faced a news backdrop with limited positive sentiment and a meaningful share of negative coverage.
GLD,Gold Articles: 3
- Positive: 66.67%
- Negative: 33.33%
Sentiment Summary: GLD/Gold coverage was moderately positive, with 67% positive and 33% negative articles across 3 articles.
Conclusion: Gold-related news tone was net positive, though the small article count limits breadth.
USO,Oil Articles: 11
- Positive: 63.64%
- Negative: 27.27%
- Neutral: 9.09%
Sentiment Summary: USO and oil coverage is predominantly positive (64%), with 27% negative and 9% neutral articles.
Conclusion: Oil-related news sentiment is net positive, which may be relevant context for indices futures traders monitoring energy-sector influence.
Market Data Snapshot
ETF Snapshot of major stock market ETFs, Mag7, and others as of: September 9, 2026 07:16
Top Movers & Losers
- TSLA 368.16 Bullish 3.98% ▲
- USO 146.03 Bullish 2.87% ▲
- GOOG 335.38 Bullish 0.02% ▲
- GLD 399.72 Bearish -1.73% ▼
- IBIT 44.39 Bearish -1.86% ▼
- NVDA 225.73 Bearish -2.01% ▼
Major Index ETFs: SPY, QQQ, DIA, IWM, IJH
- QQQ 718.36 Bearish -0.08% ▼
- IWM 294.67 Bearish -0.45% ▼
- SPY 765.96 Bearish -0.55% ▼
- IJH 75.36 Bearish -0.65% ▼
- DIA 528.03 Bearish -1.13% ▼
Major index ETFs are Bearish across the group. QQQ is the least negative mover at -0.08%, a marginal decline, while DIA is the most bearish mover at -1.13%. SPY declined -0.55%, IJH fell -0.65%, and IWM lost -0.45%, showing broader downside across large-, mid-, and small-cap exposure.
Mag 7 Stocks: AAPL, MSFT, GOOG, AMZN, META, NVDA, TSLA
- TSLA 368.16 Bullish 3.98% ▲
- GOOG 335.38 Bullish 0.02% ▲
- META 613.48 Bearish -0.53% ▼
- AMZN 256.97 Bearish -0.60% ▼
- MSFT 493.95 Bearish -1.15% ▼
- AAPL 316.22 Bearish -1.17% ▼
- NVDA 225.73 Bearish -2.01% ▼
Mixed Mag7 snapshot: TSLA is the most bullish mover at +3.98%, while NVDA is the most bearish mover at -2.01%. GOOG is marginally Bullish at +0.02%; META -0.53%, AMZN -0.60%, MSFT -1.15%, and AAPL -1.17% are Bearish.
Cross-Market ETFs: TLT, GLD, USO, IBIT
- USO 146.03 Bullish 2.87% ▲
- TLT 82.20 Bearish -0.01% ▼
- GLD 399.72 Bearish -1.73% ▼
- IBIT 44.39 Bearish -1.86% ▼
Mixed cross-market snapshot: USO is the most bullish mover at +2.87%. IBIT is the most bearish mover at -1.86%, followed by GLD at -1.73%. TLT is marginally Bearish and near-flat at -0.01%.
ETF, Mag7, and Cross-Market ETF Insights
Overall Tone
Mixed, with broad equity ETF and large-cap technology weakness offset by strong TSLA and USO gains.
Equity ETFs and Mag7:
Major Index ETFs were Bearish across the board: QQQ was marginal at -0.08%, while DIA was the most bearish index ETF at -1.13%; SPY, IWM, and IJH declined -0.55%, -0.45%, and -0.65%, respectively. Mag7 performance was selective, led by TSLA as the most bullish mover at +3.98%, while GOOG was near-flat at +0.02%; NVDA was the most bearish mover at -2.01%, with AAPL and MSFT also down -1.17% and -1.15%.
Cross-Market ETFs:
Cross-market ETFs were Mixed, with USO the most bullish mover at +2.87% while TLT was marginally Bearish at -0.01%. GLD declined -1.73% and IBIT was the most bearish cross-market mover at -1.86%, contrasting with USO strength.
Futures Indices – Higher Time Frame Analysis
Summary of the current state of US Indices Futures based on higher time-frame (HTF) technical analysis as of: 2026-09-09: 07:16 CT.
US Indices Futures
- ES: YSFG constructive, MSFG/WSFG below F0%, short-term pullback; 7475 pivot support, 7551.25–7633.25 benchmark support, 7838.50 resistance.
- NQ: YSFG constructive, MSFG/WSFG below centers; 27726.50–27201.50 supports, 28927.25–29002.25 pivot support, 30343–31090 resistance.
- YM: YSFG constructive, MSFG/WSFG below centers, DTrend; 52475 support, 51630/51948 secondary support, 53437–53862 resistance, 54884 swing high.
- EMD: YSFG constructive, MSFG/WSFG below F0%; 3713.8–3692.9 supports, 3782.9–3849.3 benchmark resistance, 3917.6–3941.7 pivot resistance.
- RTY: YSFG constructive, MSFG/WSFG below F0%; 2904.1–2914.5 support, 2983.3 near resistance, 3079.9 major pivot resistance.
- FDAX: YSFG constructive, MSFG/WSFG down; 25123–25592 pivot support, 25337 benchmark support, 26010 reversal threshold, 26665 resistance.
Overall State
- Short-Term: Bearish
- Intermediate-Term: Bearish
- Long-Term: Bullish
Conclusion
US index futures share short-term pressure below weekly and monthly Fib-grid centers following recent pivot-high rejections. ES, NQ, YM, RTY, and FDAX show aligned corrective structures, while EMD is consolidating near 3713.8 support. Yearly Fib-grid positioning and rising longer-term benchmarks maintain bullish long-term structure across the group. Overhead pivot resistance remains defined by recent swing highs, with listed pivot supports framing current pullback ranges.
Note: Intra-day counter-trend pullbacks or retracements may occur, HTF is context for informational usage and market structure. Glossary: Session Fib Grids periods of YSFG:’Yearly’, MSFG:’Monthly’, WSFG:’Weekly’
For full details visit: AlphaWebTrader Technicals
ES Daily View
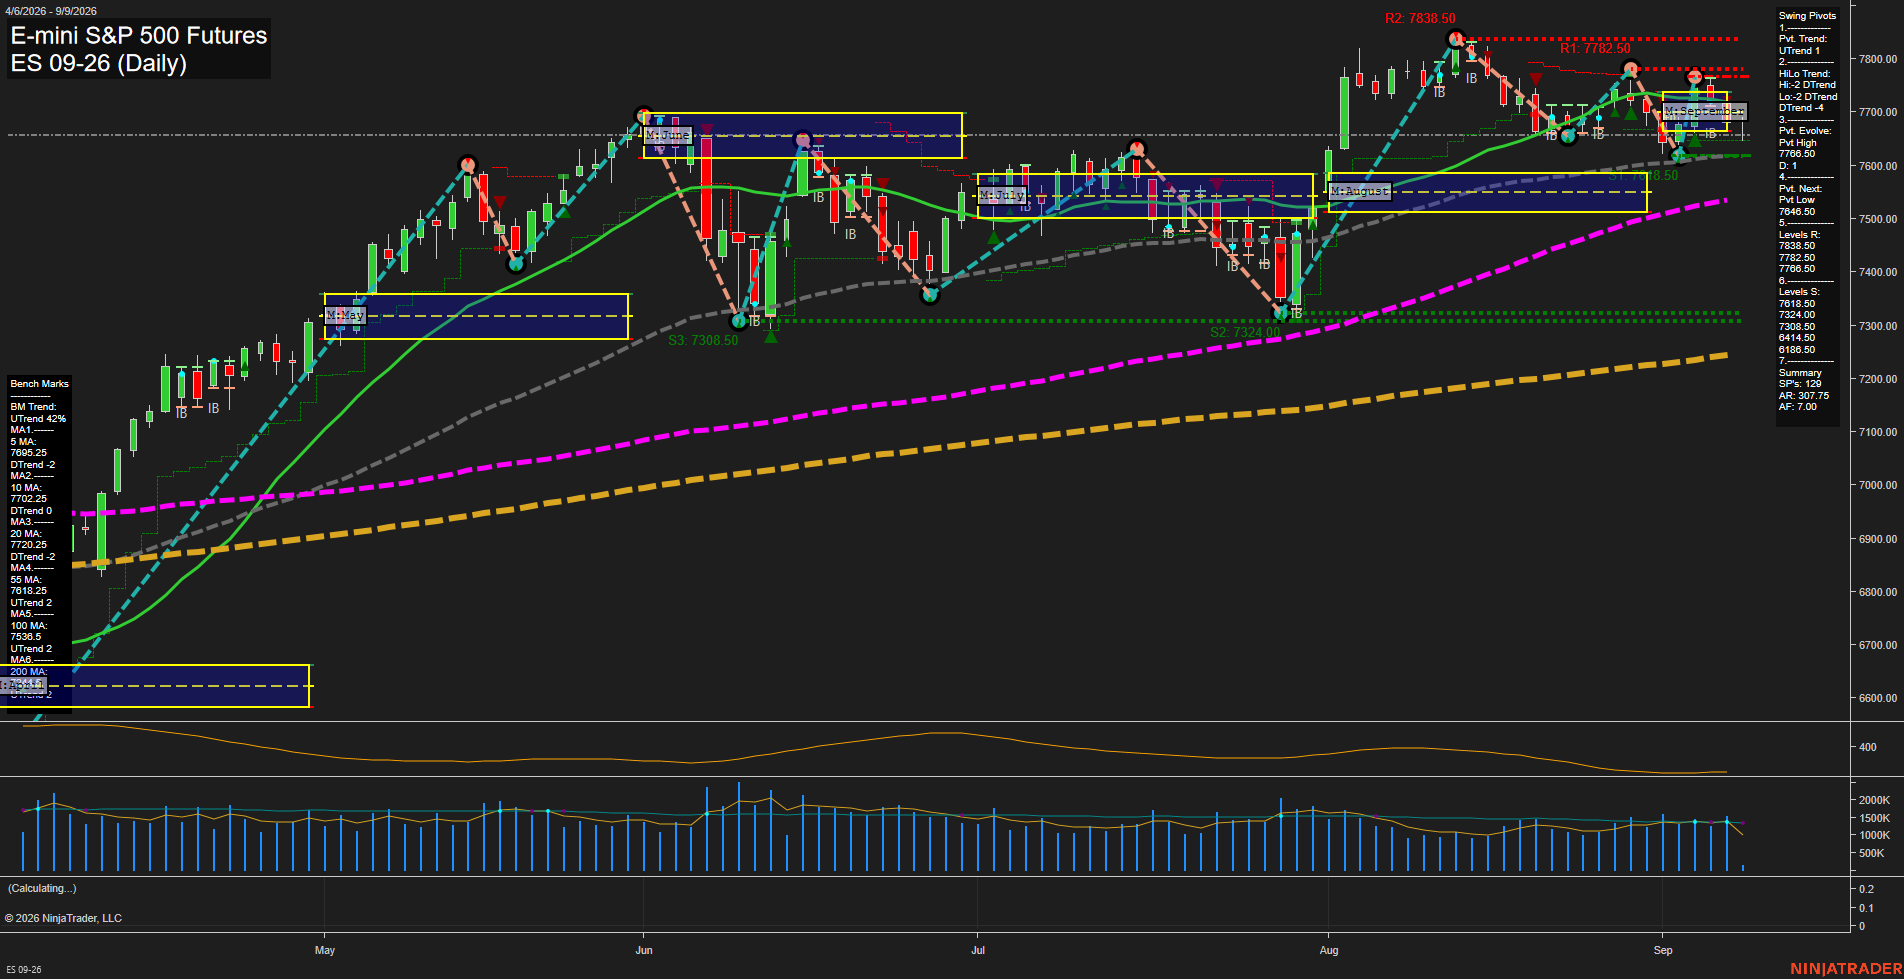
Overall Rating
- Short-Term: Bearish
- Intermediate-Term: Bearish
- Long-Term: Bullish.
Key Insights Summary
Price is consolidating beneath declining 5-, 10-, and 20-day benchmarks after rejection from the 7766.50 pivot-high area. The short-term pivot structure remains
View charts on: AlphaWebTrader HTF Charts
NQ Daily View
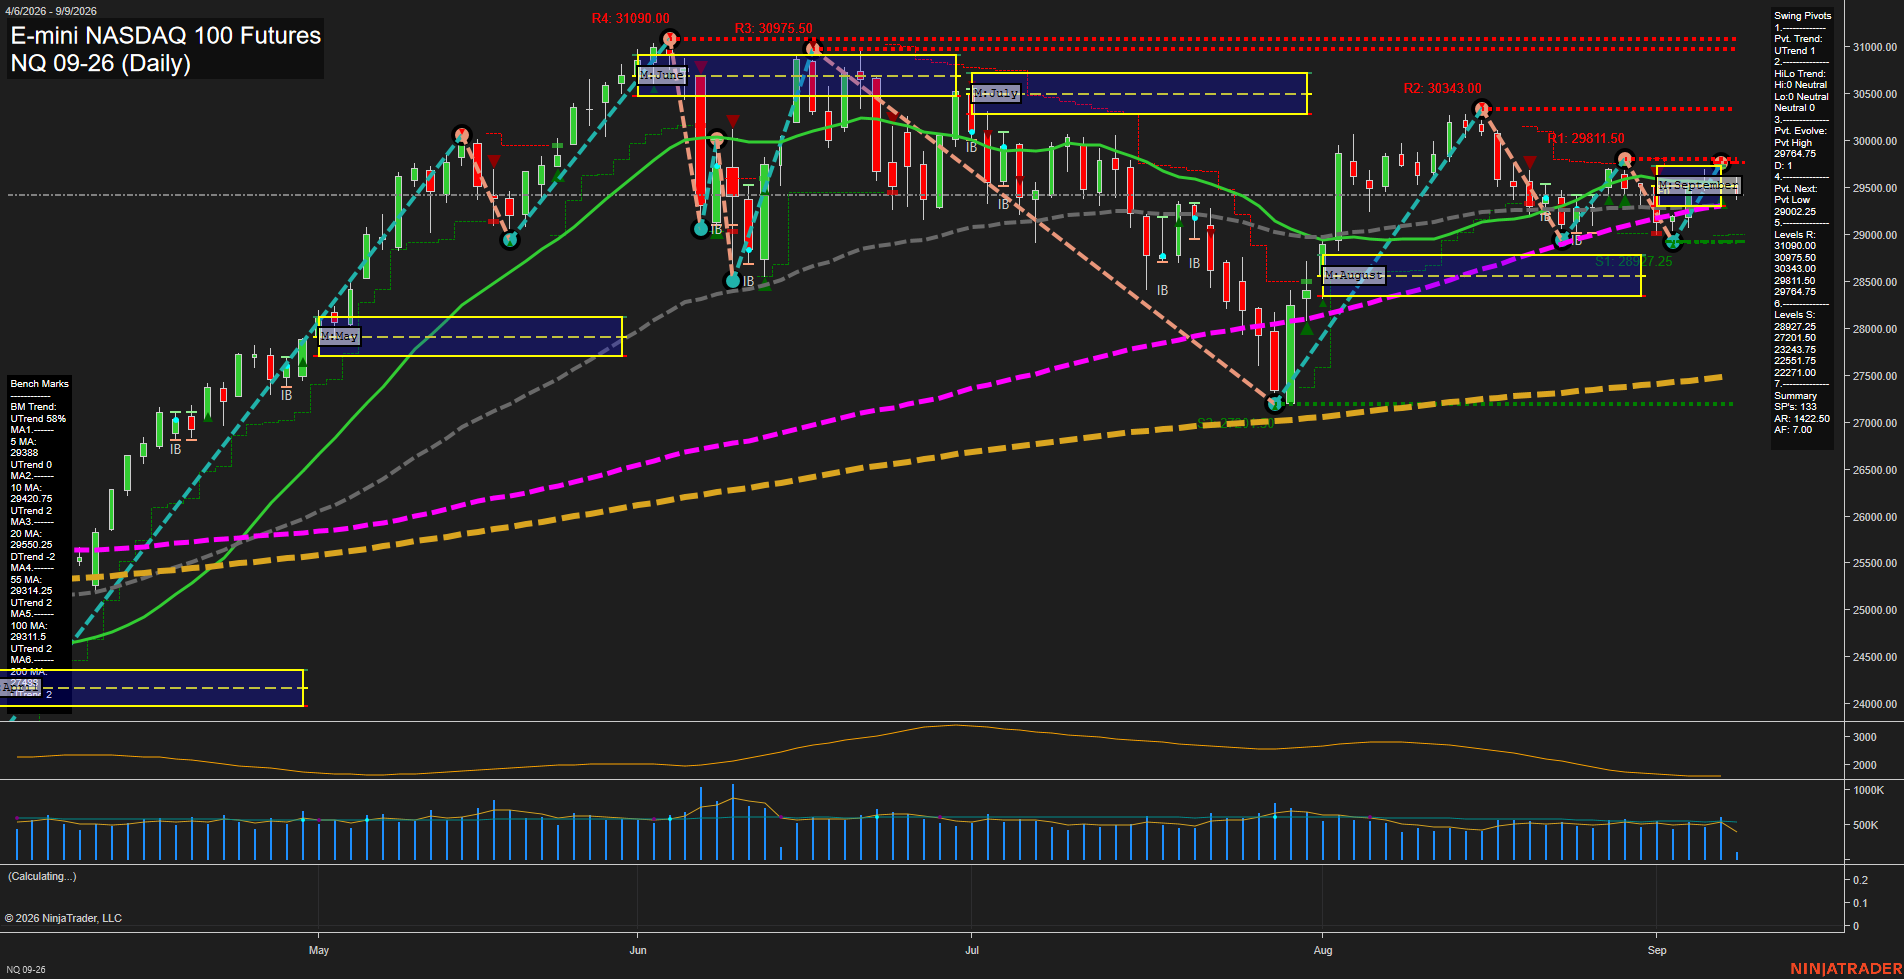
Overall Rating
- Short-Term: Bearish
- Intermediate-Term: Neutral
- Long-Term: Bullish.
Key Insights Summary
Price is consolidating beneath the September MSFG F0% area and the declining 20-day benchmark after rejection from the 29742.75 pivot high. Short-term structure remains pressured by the weekly grid and fresh short signals, while the 55-day and 100-day benchmarks remain upward sloping near current price. The 28927.25 to 29002.25 area defines the nearby pivot-support zone, with 29811.50 the first meaningful overhead pivot resistance. The broader yearly structure remains constructive above the rising 200-day average, while declining ATR and smaller daily ranges reflect a compressed, slower momentum phase.
View charts on: AlphaWebTrader HTF Charts
CL Daily View
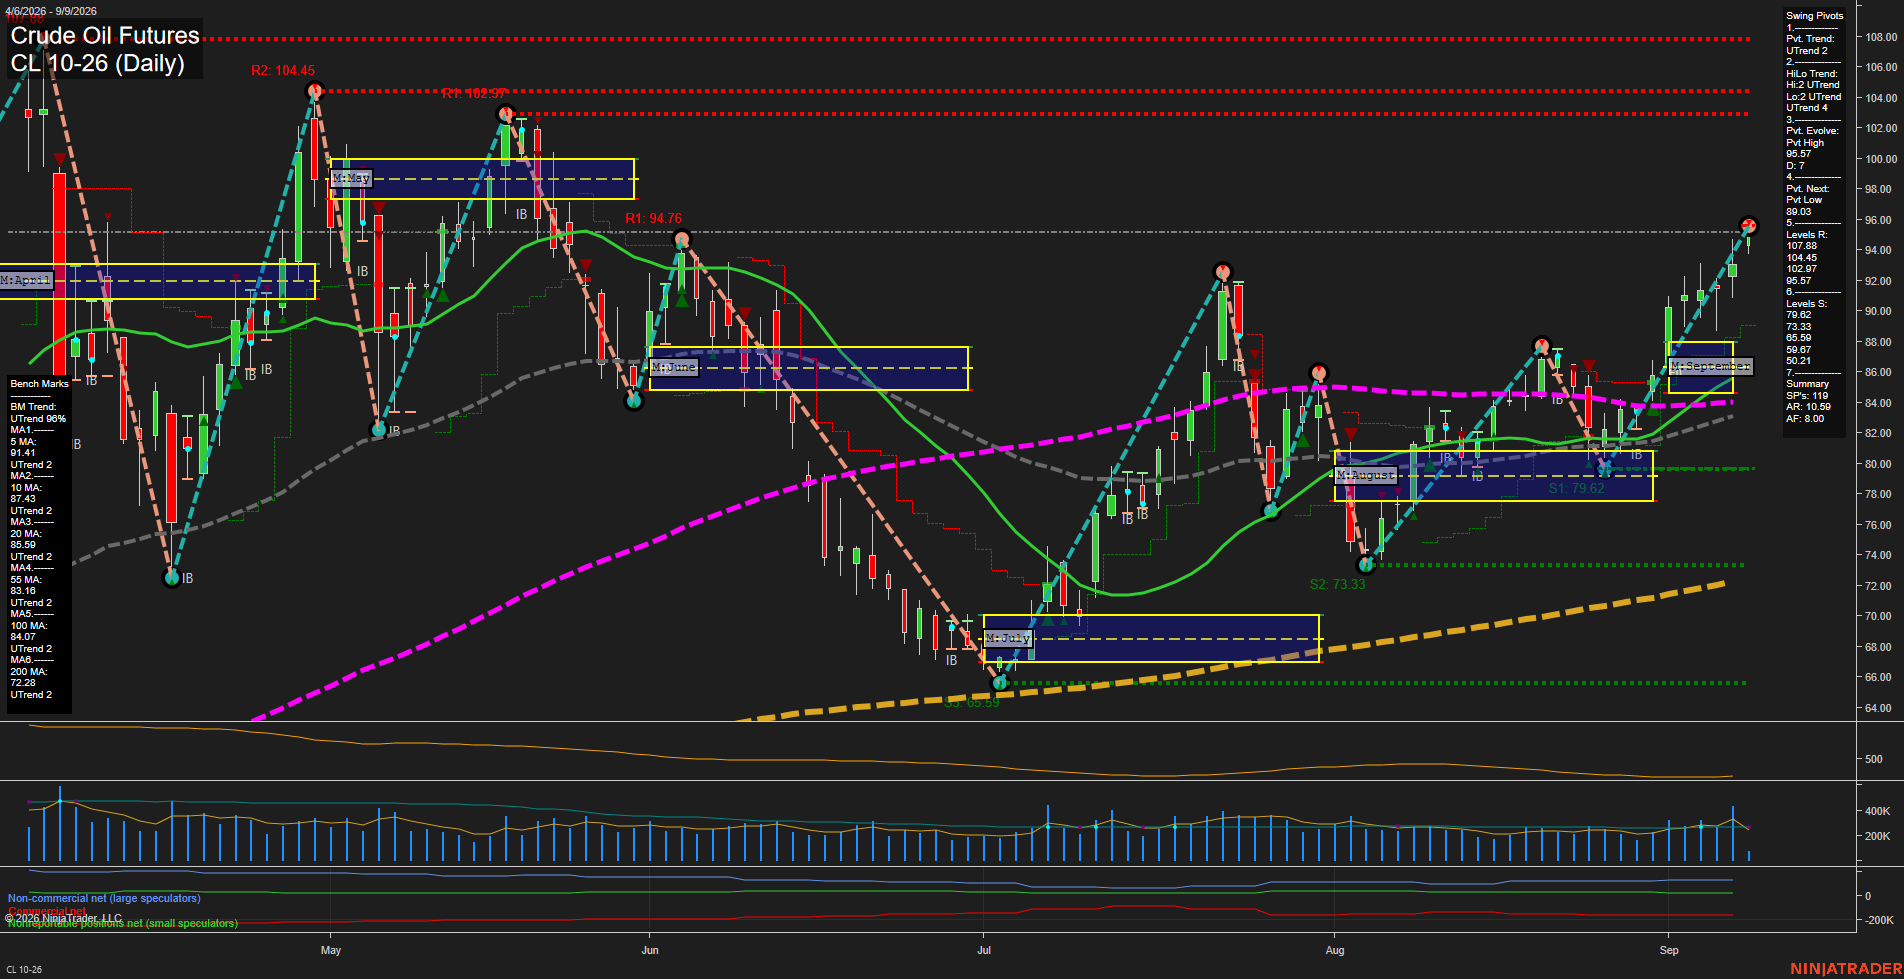
Overall Rating
- Short-Term: Bullish
- Intermediate-Term: Bullish
- Long-Term: Bullish.
Key Insights Summary
Price is in a fast, medium-range upside expansion, holding above every daily benchmark and above the weekly, monthly, and yearly fib-grid reference areas. The pivot structure remains aligned upward across short- and intermediate-term measures, with the current advance approaching the 95.57 pivot-high resistance. The recovery from the August 79.62 support area has developed into a higher-low, higher-high sequence; 90.62 is the nearest structural support beneath the current rally. Longer-term trend structure remains firmly positive, supported by the rising 100-day and 200-day averages, while the elevated daily range reflects active swing volatility.
View charts on: AlphaWebTrader HTF Charts
GC Daily View
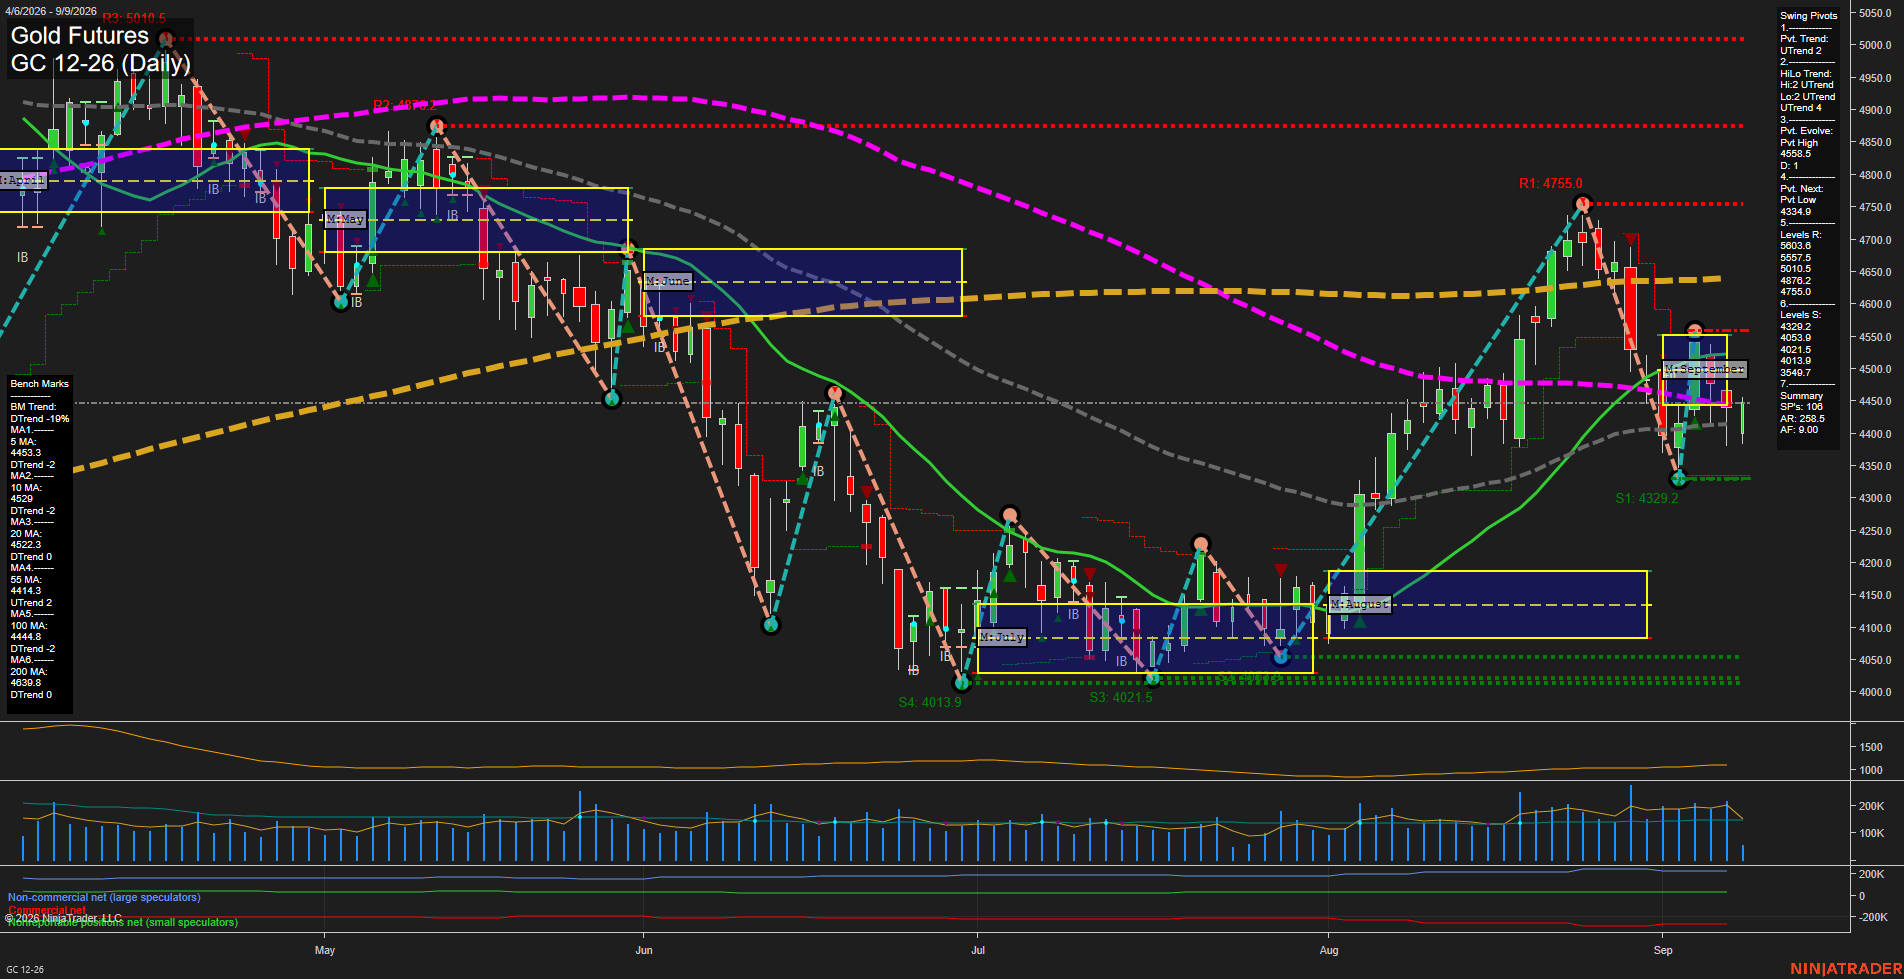
Overall Rating
- Short-Term: Bearish
- Intermediate-Term: Bearish
- Long-Term: Bearish.
Key Insights Summary
GC remains in a broad bearish technical structure, with price below the weekly and monthly Fib-grid centers and beneath the declining 5-, 10-, 20-, 100-, and 200-day benchmarks. The short-term pivot structure remains classified as an uptrend following the rebound from 4329.2, but the recovery is trading below nearby moving-average resistance around 4444.8 to 4529.0. The September rally failed beneath the 4755.0 pivot resistance area and reversed sharply, leaving 4334.9 as the active downside pivot threshold. The 55-day average at 4414.3 is the immediate stabilizing reference, while 4329.2 is the principal nearby support; a loss of that level returns focus to the 4033.9 to 4013.9 support cluster. Elevated ATR reflects a volatile, wide-swing environment with a counter-trend rebound developing inside a larger downtrend.
View charts on: AlphaWebTrader HTF Charts