Index futures hold bullish multi-timeframe trends near resistance as inflation, Fed policy, yields, breadth and Gulf oil risks shape market sentiment.
Fundamentals: Index futures begin the week amid competing signals from improving equity breadth, energy-led revenue growth and pressure from rising Treasury yields. Consumer inflation data remains central to the Fed policy discussion, while uncertainty over Gulf transit and Hormuz reopening conditions has lifted oil-supply concerns. Technology and AI remain key equity themes as financials lag the broader market.
Technicals: U.S. and global equity index futures enter the session with bullish short-, intermediate- and long-term technical structures across the S&P 500, Nasdaq, Dow, Russell 2000, E-mini S&P MidCap, DAX and related contracts. Recent advances have pushed several markets toward pivot-high resistance, while smaller consolidation ranges and countertrend signals indicate near-term momentum is moderating.
Market Week Ahead – Trading 360° view Market Radar for: holidays, earnings, eco-news, market-news summary, news sentiment, and major ETFs, MAG7, Higher Time Frame Analysis Indices Futures Summary, and ETF SPY S&P500, QQQ Tech, USO Oil, GLD Gold Weekly Chart analysis
As of: August 9, 2026 06:15 CT
Earnings Radar
Monitoring for earnings releases by the Magnificent 7, AI-tech-related firms, and major financial institutions.
- SMCI Release: 2026-08-11 T:AMC
Conclusion: Super Micro Computer (SMCI) reports after the close on 2026-08-11, placing AI-server and semiconductor-infrastructure earnings sensitivity into the next session’s index-futures context. Market momentum and volume can slow ahead of major earnings releases, especially MAG7, AI, semiconductors, and related tech names.
For full details visit: Yahoo Earnings Calendar
Market News Summary:
Index futures enter the week with inflation and Iran-related oil supply uncertainty offsetting broad equity and corporate-sales support.
Primary Drivers & Risks:
- Primary Driver: Inflation data and Fed policy
- Primary Risk: Iran-related energy supply disruption
Tone:
Mixed, with resilient equity breadth alongside rate and energy pressure.
Stock Market / ETFs / Indices:
Market breadth has improved, with the average stock outperforming the S&P 500 for the first time in four years. S&P 500 sales growth has been supported by a 42.5% second-quarter revenue gain for energy companies. Technology and AI remain key equity themes, while financials have lagged the broader index year to date.
Geopolitical:
Iran uncertainty remains a focus for the new trading week. Delays to a workable Hormuz reopening, driven by fees, vessel restrictions, and insurance risks, have increased concerns around Gulf transit conditions.
Oil / Energy:
Brent and WTI recovered as Gulf supply risks returned, with Brent reclaiming its 50-day moving average. Elevated energy prices have also contributed to inflation concerns and stronger S&P 500 revenue growth.
Fed / Financials:
Upcoming consumer inflation data is central to the policy outlook. A firm inflation reading keeps a September Fed rate hike in discussion despite market positioning for no change. Long-duration Treasuries have weakened as 30-year yields rose and TLT entered a correction amid outflows and rising public-debt concerns.
Macro / Other:
Consumer brands report stronger overseas revenue even as domestic sales slow. Restaurant demand has faced pressure from food-safety concerns and related ingredient removals at several chains.
Conclusion:
Inflation data, the Fed-rate outlook, and Gulf oil-supply disruption are the central near-term market drivers. Stronger market breadth and energy-led sales growth provide countervailing support.
Rising long-term Treasury yields and pressure on long-duration bonds remain key cross-currents. Iran uncertainty and elevated energy prices add inflation-sensitive risk to index trading conditions.
Market News Sentiment
Market News Articles: 11
- Neutral: 63.64%
- Positive: 27.27%
- Negative: 9.09%
Sentiment Summary: Market news sentiment is predominantly neutral (64%), with positive coverage at 27% and negative coverage at 9%.
Conclusion: The news backdrop for indices futures is broadly neutral, with positive articles outweighing negative articles.
No stock-related news items found.
Sentiment Summary: No stock-related news items were identified, indicating no measurable news-driven sentiment signal for indices futures day traders.
Conclusion: The snapshot provides no market-specific news basis for assessing near-term index futures sentiment.
USO,Oil Articles: 1
- Positive: 100.00%
Sentiment Summary: USO/Oil coverage was 100% positive across 1 article.
Conclusion: Oil-related news tone was uniformly positive, though based on limited article volume.
SPY Weekly View
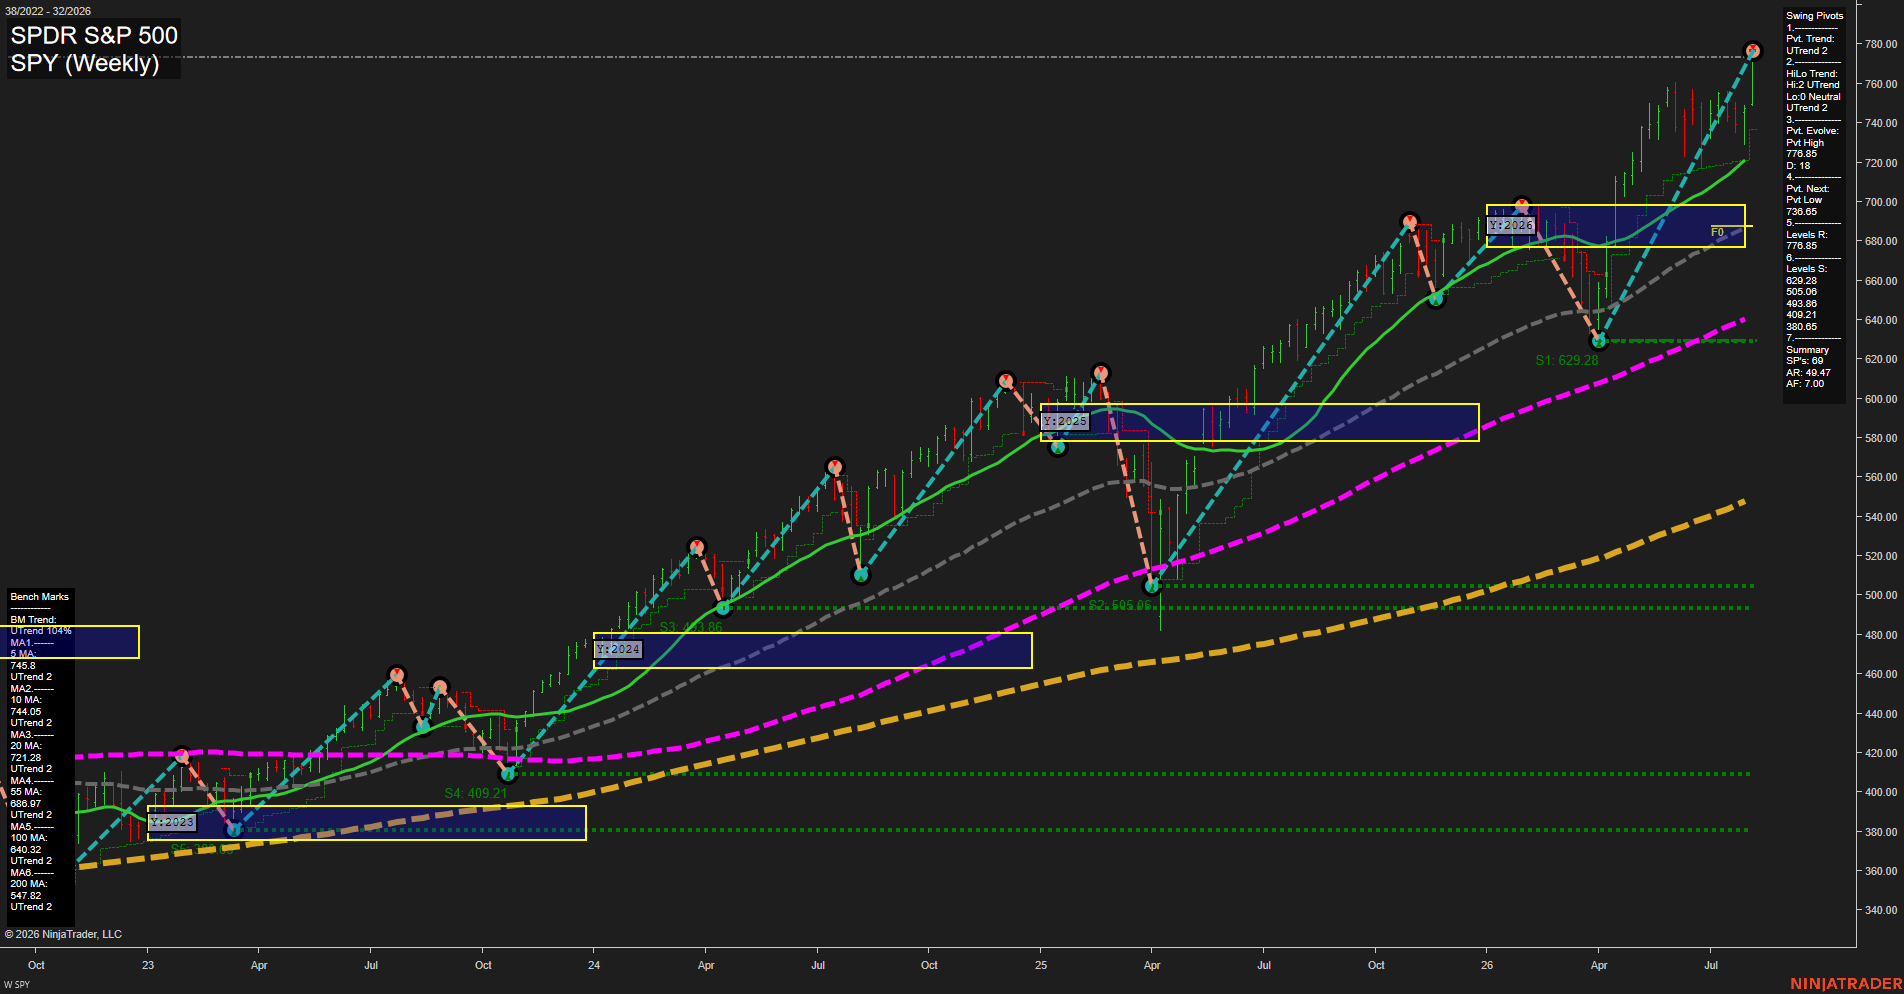
Overall Rating
- Short-Term: Bullish
- Intermediate-Term: Bullish
- Long-Term: Bullish.
Key Insights Summary
The futures swing-trader structure is broadly bullish: price is extending to a new pivot high near 776.85 while holding above every rising benchmark average. The advance is fast and the recent weekly ranges are large, indicating elevated directional momentum and expanding volatility. The 736.85 pivot-next level defines the nearest structural reversal reference, while the 721.28 20-period benchmark and the 686.97 55-period benchmark mark deeper trend support. The annual 2026 Fib grid has been exceeded on the upside, reflecting a strong long-cycle expansion rather than consolidation. The immediate condition is extended above the short-term averages, but the pivot sequence remains higher-high and higher-low bullish unless a downside pivot develops.
View charts on: AlphaWebTrader HTF Charts
QQQ Weekly View
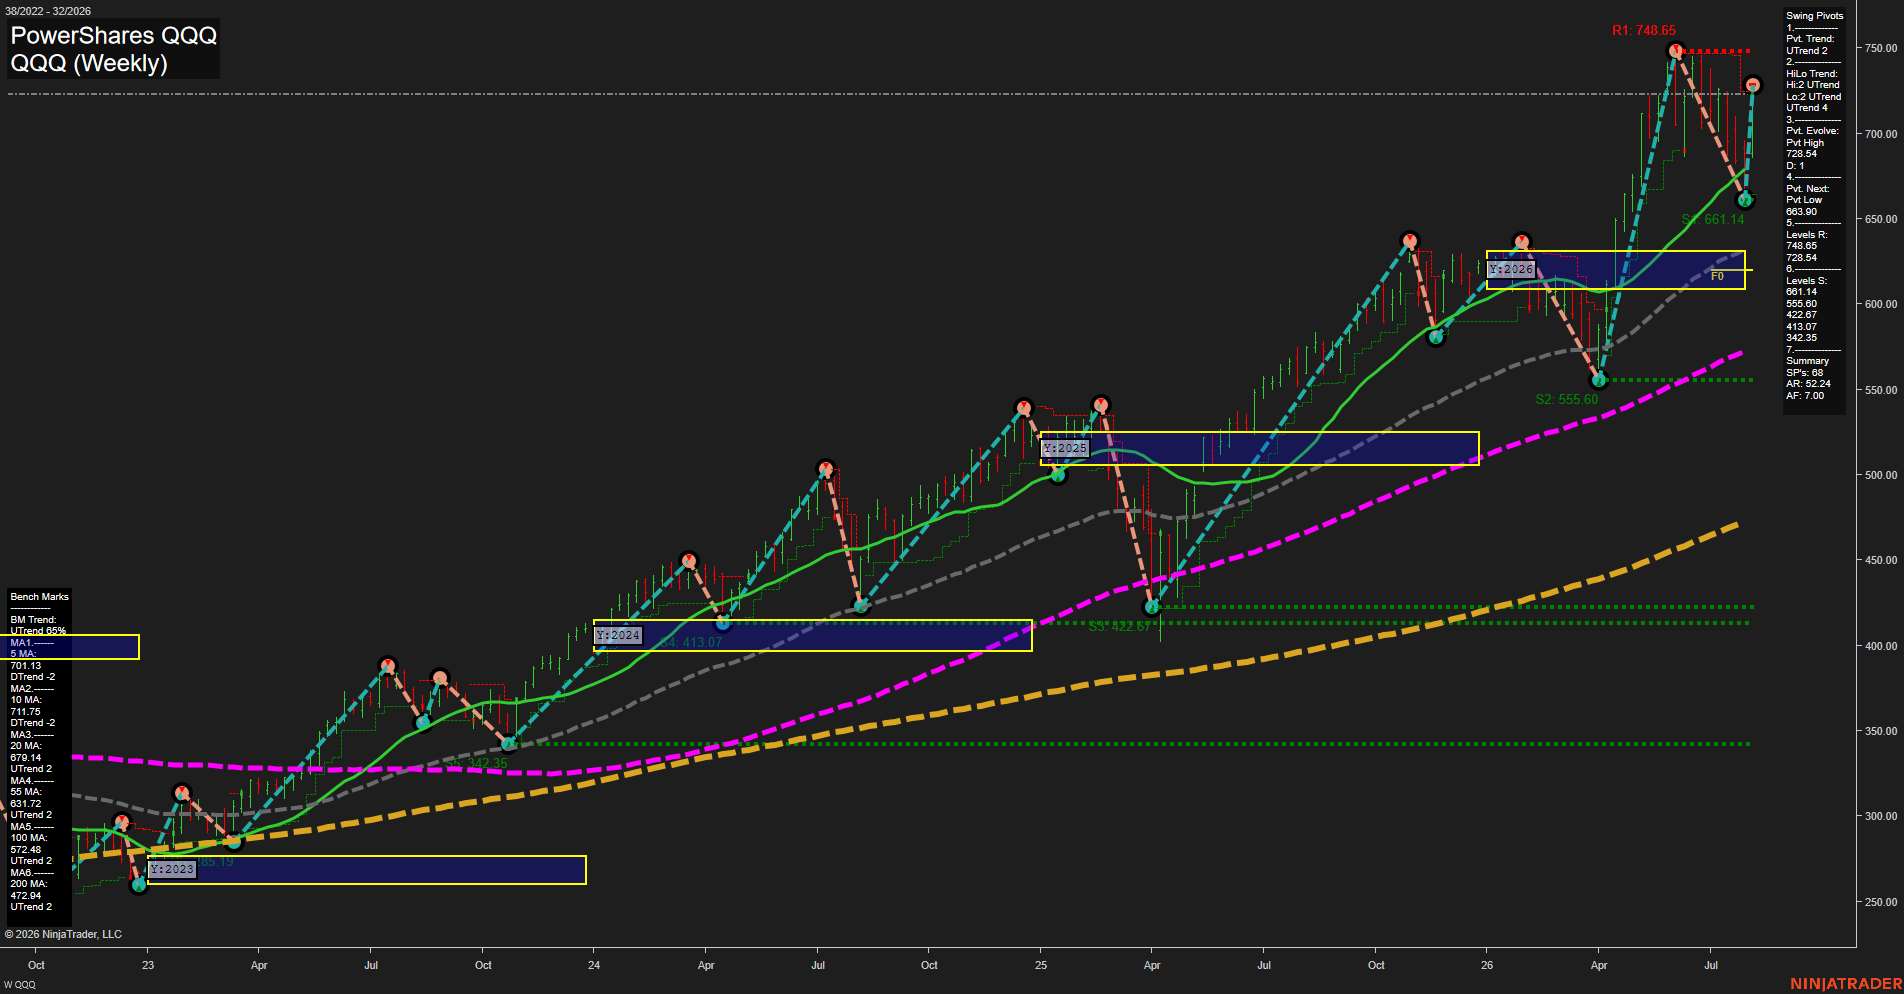
Overall Rating
- Short-Term: Bullish
- Intermediate-Term: Bullish
- Long-Term: Bullish.
Key Insights Summary
QQQ reflects a strong weekly futures-swing structure: price has rebounded sharply from the 663.90 pivot-low area and is pressing the 728.54 pivot-high level. The larger trend remains constructive, with price above all displayed benchmark averages and the 20, 55, 100, and 200 period averages rising. The immediate auction is volatile and fast, with 728.54 acting as the near-term pivot threshold and 748.65 as the higher resistance reference. A rotation below the active high would leave 701.13, 679.25, and 663.90 as the principal weekly structure references, while the broad higher-high and higher-low sequence remains intact.
View charts on: AlphaWebTrader HTF Charts
USO Weekly View
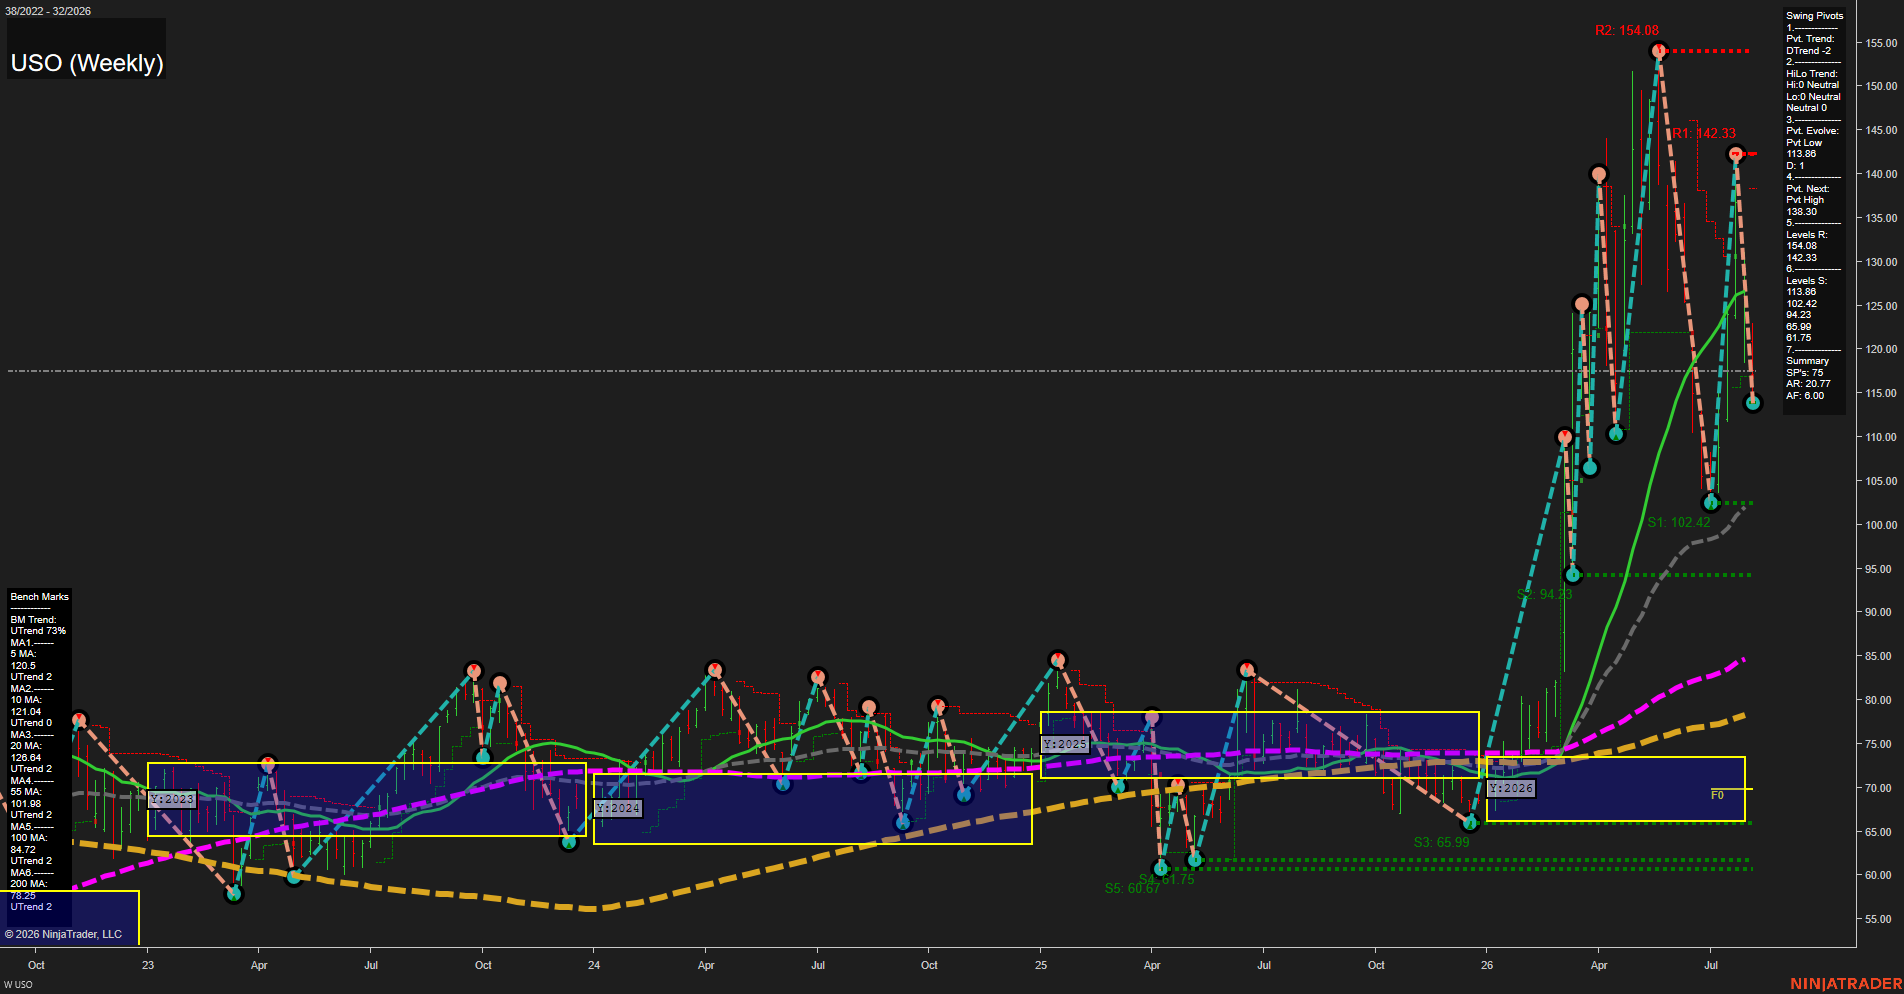
Overall Rating
- Short-Term: Bearish
- Intermediate-Term: Bullish
- Long-Term: Bullish.
Key Insights Summary
USO remains in a powerful long-term expansion above its yearly value area and all major weekly benchmark averages, reflecting a broadly constructive crude-oil proxy trend. From a futures swing-trader perspective, the immediate structure is a fast, high-volatility countertrend selloff: price is below the 5-, 10-, and 20-week benchmarks, the short-term pivot state is DTrend, and 142.33 marks the principal nearby swing resistance. The 113.86 pivot low is the active short-term reference, with 102.42 and 94.23 defining deeper retracement structure. Intermediate and long-term conditions remain bullish because the 55-, 100-, and 200-week averages are rising substantially below price, while the pivot hierarchy remains neutral rather than broadly bearish.
View charts on: AlphaWebTrader HTF Charts
GLD Weekly View
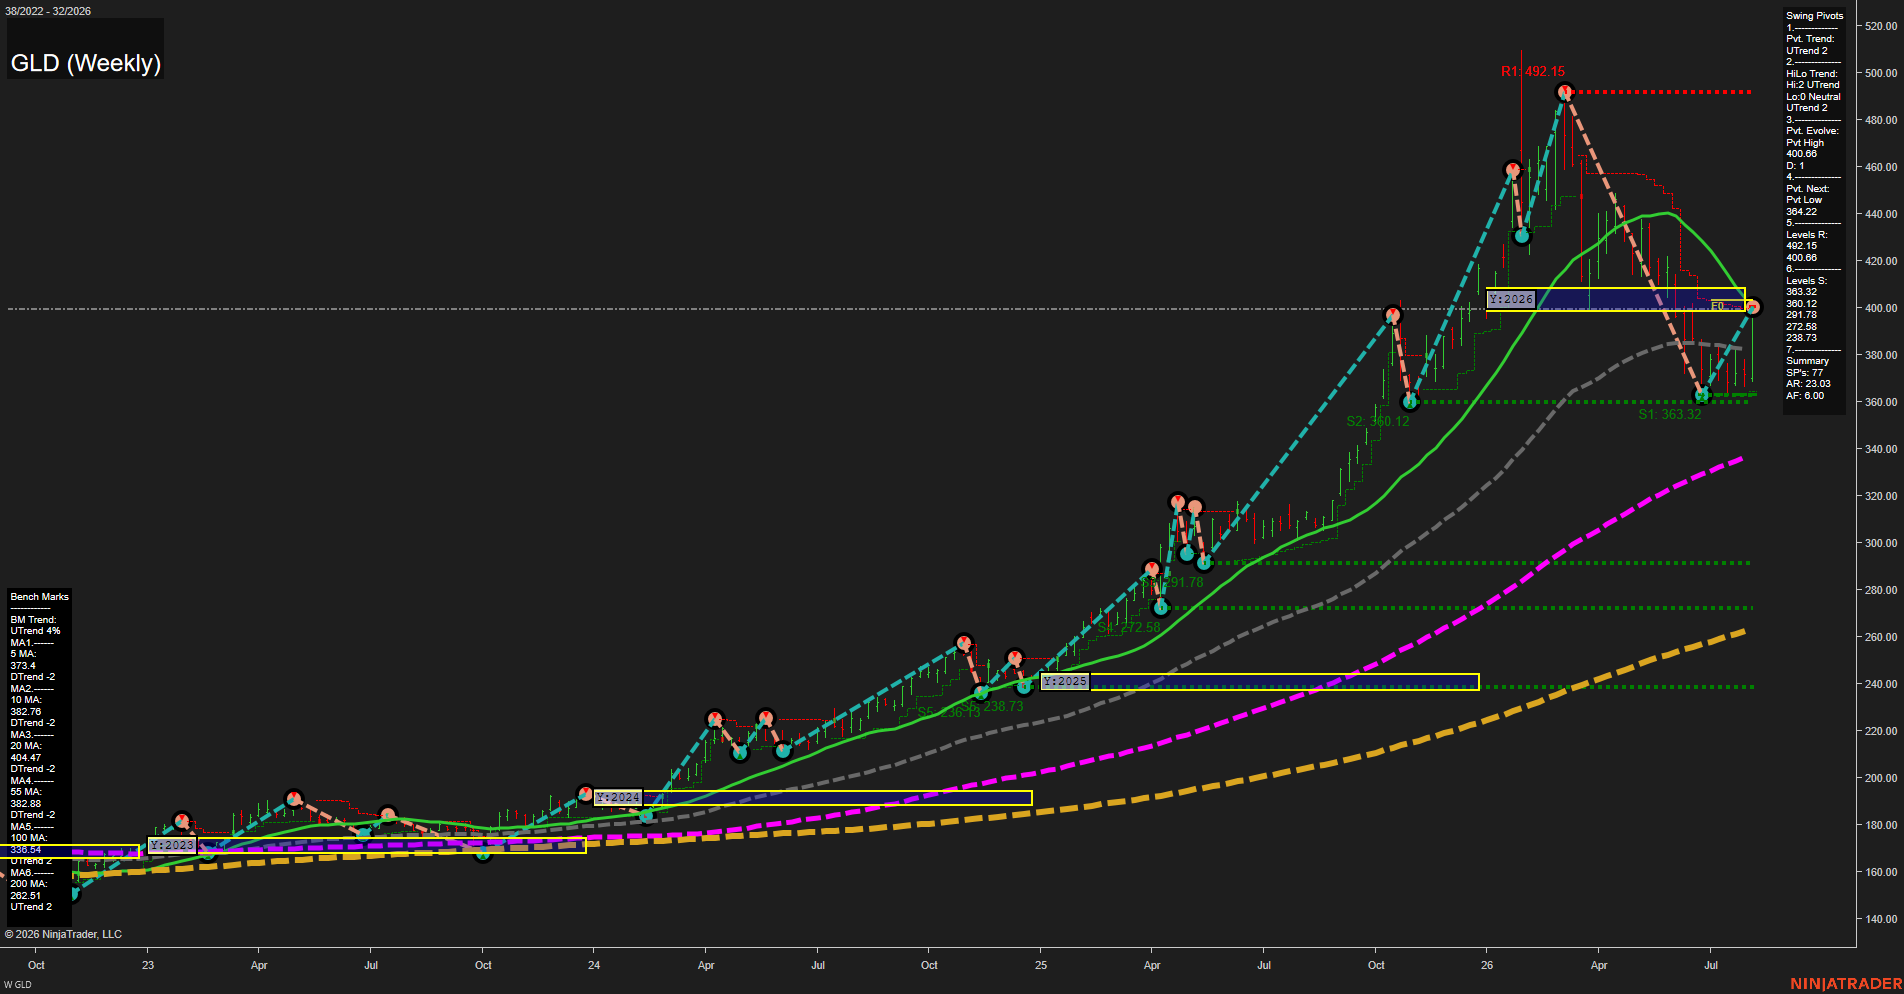
Overall Rating
- Short-Term: Neutral
- Intermediate-Term: Bullish
- Long-Term: Bullish.
Key Insights Summary
GLD has recovered sharply from the 360.12 to 363.32 support cluster and is now testing the 400.68 pivot-high/F0% area. The weekly pivot structure remains upward in both the short-term and intermediate-term measures, while the broader futures-style trend remains constructive above rising 55-, 100-, and 200-period benchmarks. Near-term action is mixed because price is marginally below the declining 20-period benchmark and the 5- and 10-period benchmarks remain in down trends. The chart therefore reflects a broad bullish trend with a short-term consolidation and resistance test beneath 400.68; 492.15 remains the major overhead swing resistance, while 363.32 and 360.12 define the principal recent swing-support zone.
View charts on: AlphaWebTrader HTF Charts